AI Observability: Debugging Agentic Failures in Production 2023
Learn how AI observability can help you debug agentic failures without stack traces. Uncover logs, metrics, and best practices for effective agent monitoring.

AI Observability for Tracing Agentic Failures Without a Stack Trace
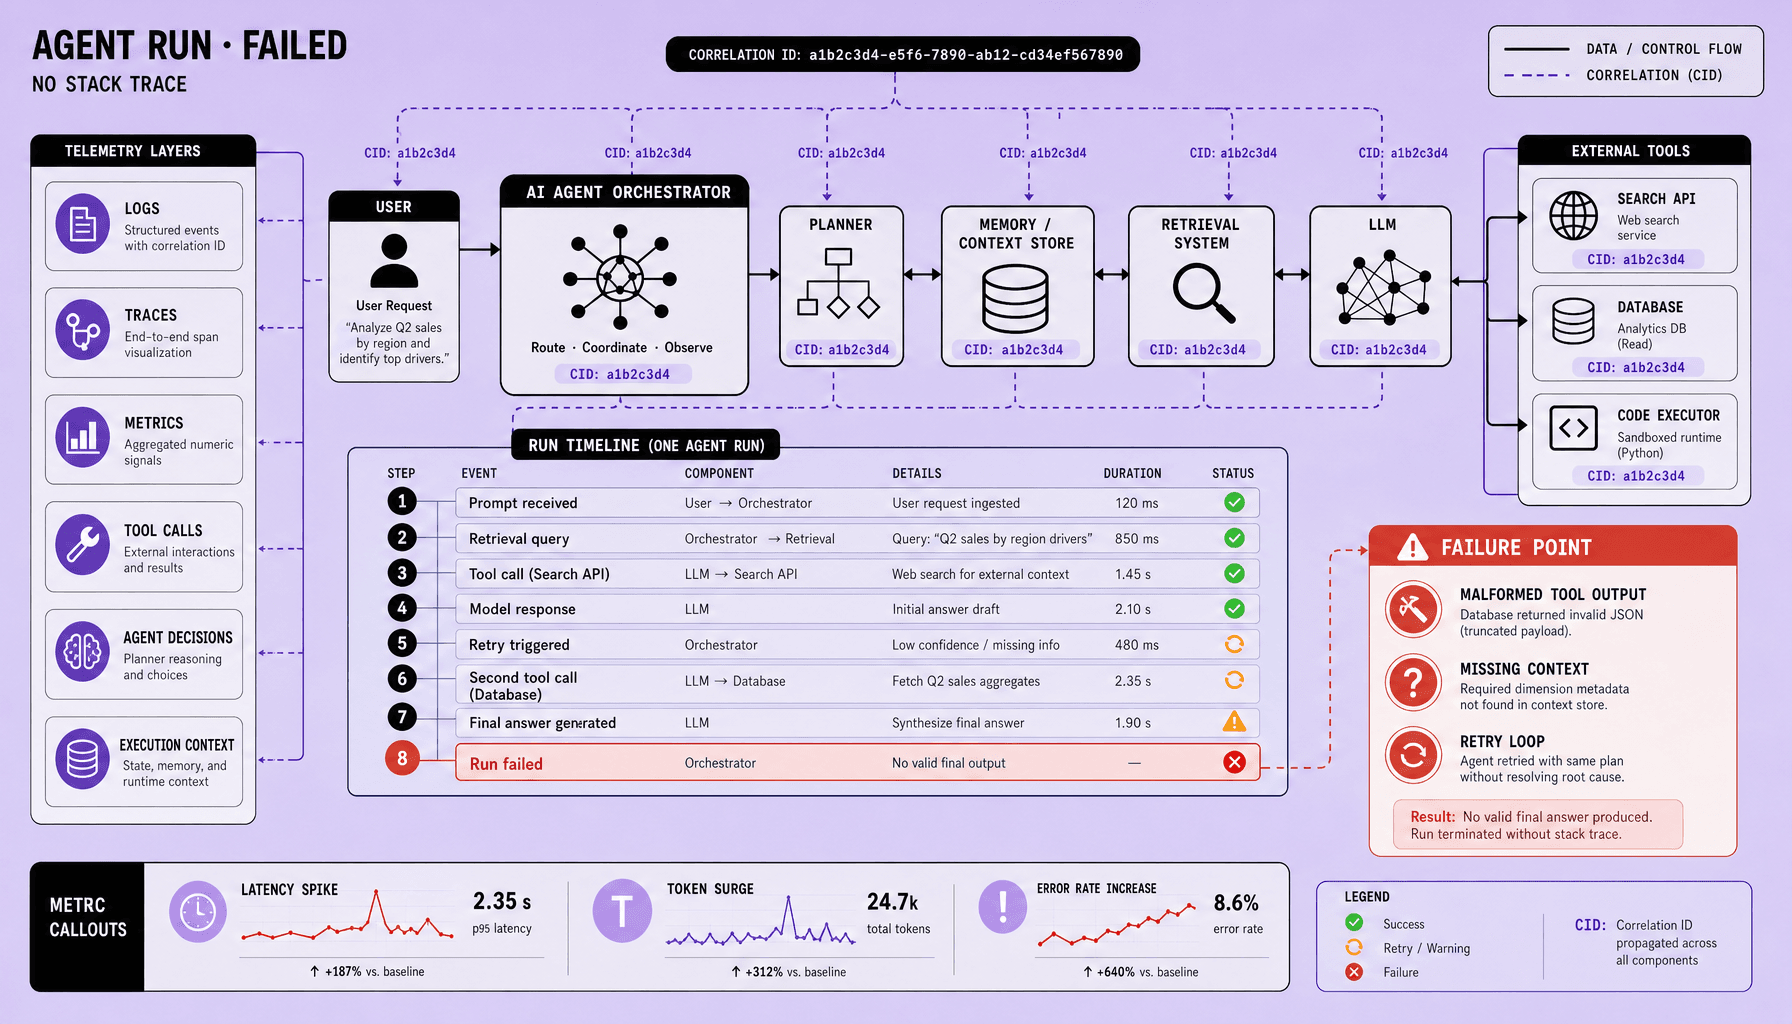
Your agent returns a polished answer, the API stays green, and nothing crashes. Users still get the wrong result. That is the hard part of debugging agentic systems: the failure often lives inside the decision chain, not in an exception or a single broken line.
AI observability gives you a way to debug that behavior when there is no stack trace to follow. It captures the evidence around the failure -- logs, LLM tracing, tool calls, context, and decision steps -- so you can explain why the agent went wrong and fix it fast.
Traditional monitoring misses the real problem. Agentic AI failures often look “successful” at the system level while the agent chooses the wrong tool, drops retrieval context, retries badly, or produces a confident wrong answer. Good agent observability reconstructs that path with correlation IDs, prompt and model version IDs, token counts, latency, retrieval metadata, and trace spans for planner, tool call, retrieval, and final response. Start with OpenTelemetry-compatible traces if you can. Capture whether a tool result was available, delayed, ignored, or overwritten.
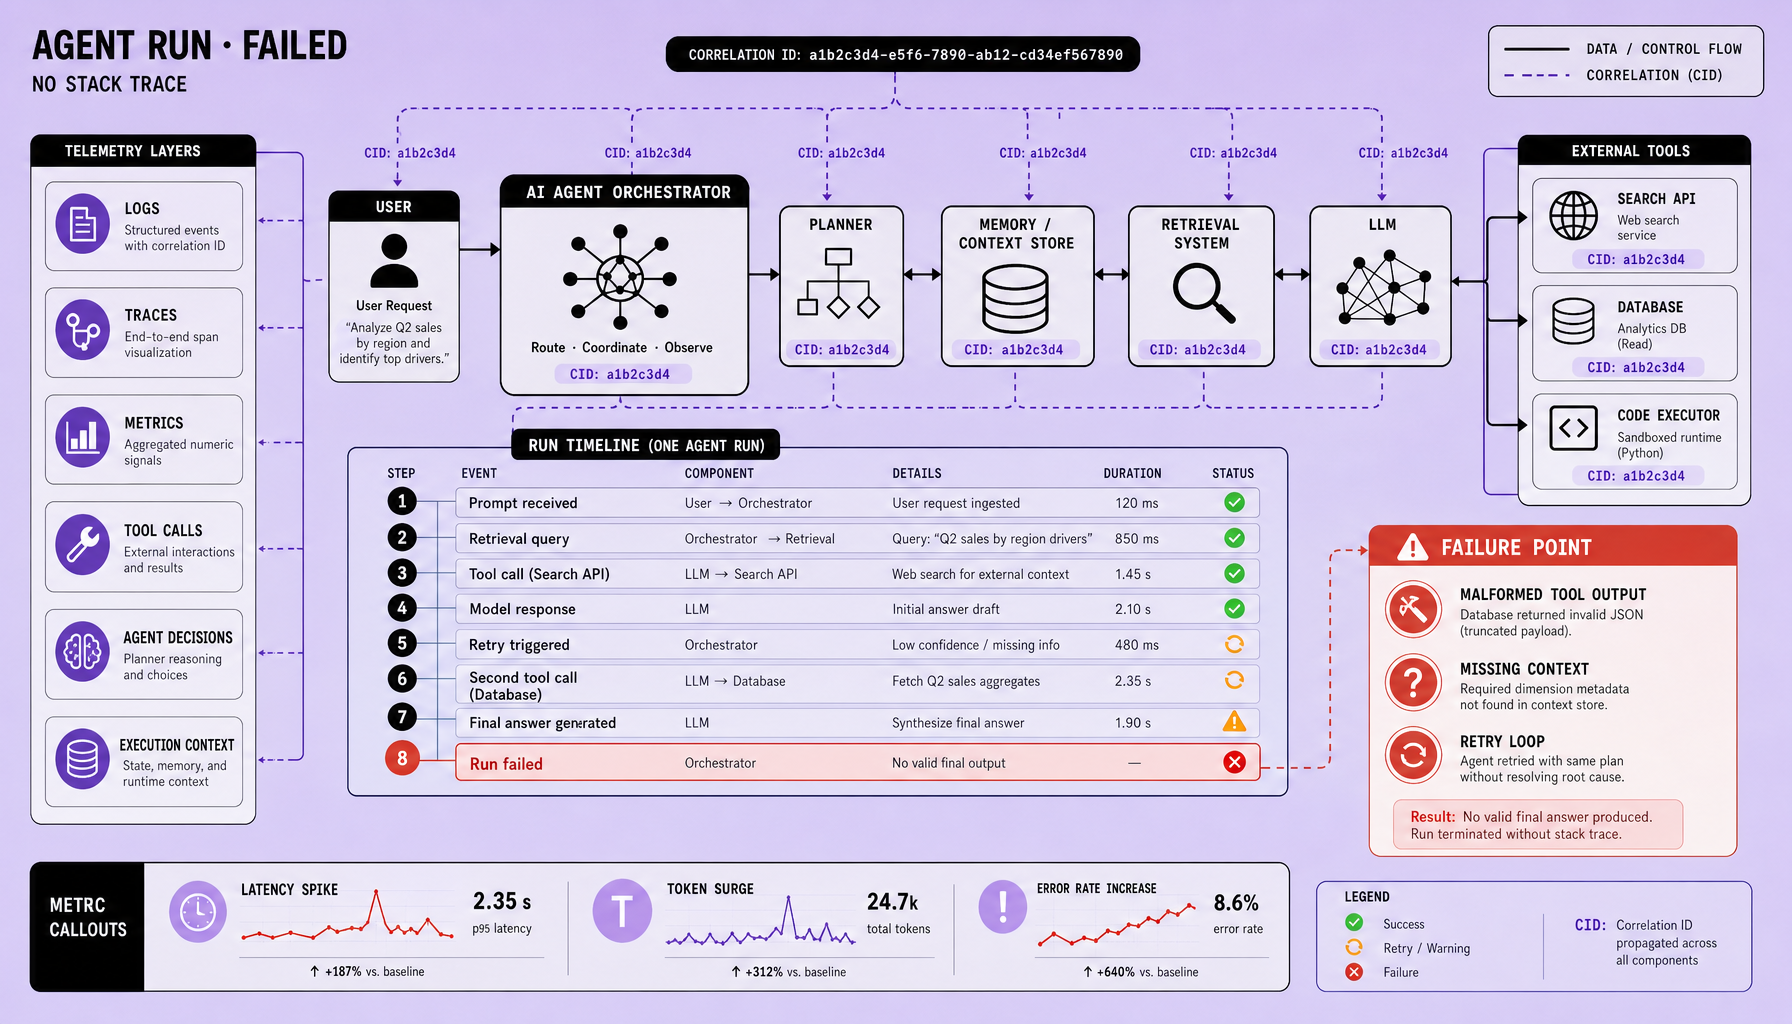
Monitoring matters just as much as deployment, so AI agent monitoring should feed metrics and alerting too -- retry spikes, latency percentiles, tool error rates, empty retrievals, and fallback frequency. Teams at places like Imversion Technologies Pvt Ltd treat this as a debugging workflow, not just telemetry storage.
Key Takeaways
-
Agentic AI failures are hard to debug because nothing may crash. You get a plausible answer, but the real issue sits inside a chain of decisions -- planner steps, retrieval noise, bad tool selection, missing context, or silent retries.
-
Strong AI observability depends on combining logs, LLM tracing, tool-call records, and decision metadata. Capture concrete fields: correlation IDs, prompt/version IDs, token counts, latency percentiles, retry counts, retrieved document metadata, and final response outputs.
-
Correlation IDs are non-negotiable. Without them, AI agent monitoring turns into guesswork across services, vector retrieval, orchestration layers, and external tools. Context must travel with the trace or you will miss the failure path.
-
Build agent observability around a repeatable AI debugging workflow: start with the user session, follow the trace span-by-span, inspect tool inputs and outputs, compare prompt and model versions, then check metrics and alerts for broader patterns.
-
Monitoring is as important as deployment. Alert on failure patterns -- tool error spikes, looping behavior, timeout clusters, token surges, and low-confidence decisions -- but avoid noisy alerts that hide real agentic AI failures.
Why Agentic AI Failures Are Hard to Debug in Production
The painful cases are not the obvious ones. Production agents can return something that looks reasonable while the real mistake happened three steps earlier, with no exception, no stack trace, and no single broken line to inspect.
Traditional applications often fail in clearer ways: an exception, a crashed service, or a reproducible code path. Agentic systems often do not. The visible output may look reasonable while the underlying issue sits somewhere across prompts, retrieval, tool use, memory state, or orchestration.
The main challenge is causality. A wrong answer may start several steps earlier: noisy retrieval, truncated context after a timeout, a planner selecting the wrong tool, or a guardrail acting too late. Model behavior is probabilistic too, so the same input may not produce the same intermediate decisions on every run. Simple replay is less reliable here than it is for deterministic software.
Soft failures are especially expensive in production because they look valid. A hard failure is obvious: a tool returns 500, a workflow times out, or a model call exceeds quota. A soft failure is subtler: the agent answers confidently but drops a prior constraint, ignores the relevant retrieval chunk, or queries the wrong system. Users see a usable-looking response, not an error.
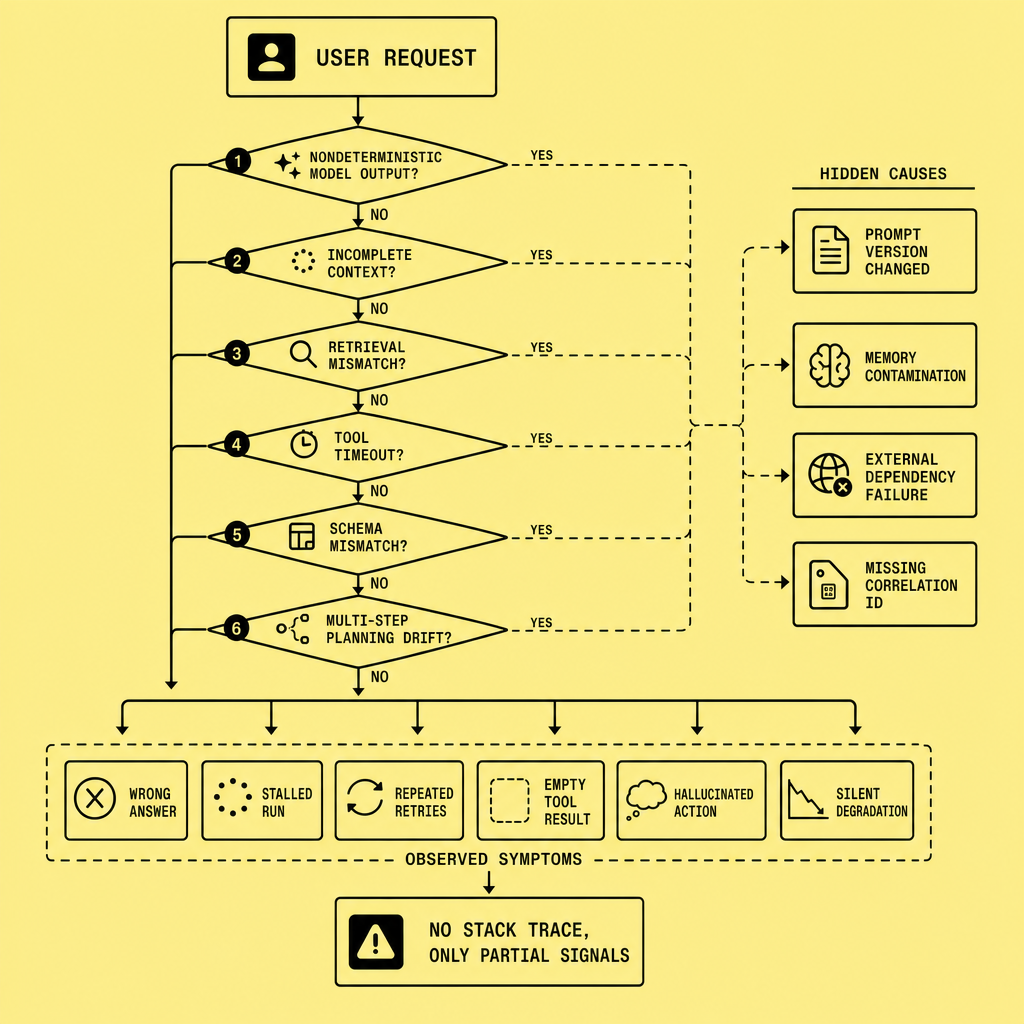
That is why standard APM, while still useful for latency, error rates, and infrastructure health, usually does not explain decision-level failures. To debug agent behavior, treat each run as a traceable workflow rather than a single request. In practice, that means capturing planner steps, retrieval metadata, tool-call inputs and outputs, prompt or workflow versions, retries, token usage, guardrail events, and a correlation ID that ties the run together.
There is a cost to doing this well. Richer traces add storage, review time, and possible privacy concerns. A sensible starting point is to instrument the highest-risk paths first and avoid logging sensitive raw content unless you actually need it for diagnosis.
FAQs
Why are AI agents harder to debug than traditional applications?
Because failures often come from multi-step decisions, probabilistic model behavior, retrieval noise, or tool misuse instead of a single exception or broken function.
What is a soft failure in an AI agent?
A soft failure is a plausible but wrong outcome, such as choosing the wrong tool, dropping context, or answering confidently from weak retrieval.
What should agent observability capture?
Capture traces, logs, tool calls, prompt versions, retrieval metadata, token usage, latency, retries, guardrail events, and correlation IDs.
Why is standard monitoring not enough for agentic systems?
Standard monitoring shows service health and errors, but not why the agent made a bad decision or how context changed across steps.
How does AI agent monitoring help in production?
It helps you detect failure patterns early, connect bad outputs to intermediate steps, and build faster, repeatable AI debugging workflows.
AI Observability Signals That Matter: Logs, Traces, Metrics, and Tool Calls
If you want debuggable agents, instrument decisions, not just errors. Raw logs rarely explain agent failures because the break often happens between retrieval, planning, tool use, and final answer assembly.
Here is the practical split: logs tell you what ran, traces tell you how it unfolded, metrics show whether the pattern is spreading, and tool telemetry proves what the agent actually used.
Logs: capture normalized run facts
Use structured logs with consistent fields across runs and services. At minimum, capture correlation ID, session or request ID, agent or run ID, prompt ID and version, model name, temperature, retrieved document IDs, token usage, latency, retry count, final status, and guardrail events. Also note whether a response was streamed, truncated, or timed out.
Structured fields matter because they let you compare failed and successful runs without guessing what changed.
LLM tracing: reconstruct the chain of decisions
Tracing should represent the workflow as spans, not one opaque event. A typical run may include planner, retrieval, tool-selection, tool-execution, memory, and final-response spans.
For each span, record start and end time, parent span, prompt or version IDs, model name, token counts, latency, retries, and a brief output summary. The goal is to reconstruct how the system moved from one decision to the next.
If you use an agent framework, map its steps into a trace model you can inspect consistently across systems.
Metrics: watch behavior at scale
Single-run inspection helps you explain one bad answer. Metrics tell you whether you have one bad run or a pattern that is starting to repeat.
Useful signals include request volume, success rate, tool error rate, retry count, token usage, p95 latency, timeout rate, and guardrail trigger rate.
Also watch for behavioral shifts such as rising retries, empty retrievals, or expensive runs with weak results. Those changes often show up before a failure becomes obvious to users.
There is a tradeoff: richer telemetry improves debugging, but increases storage cost and privacy risk. Sample carefully, redact sensitive data, and reserve full payload capture for short retention windows or higher-risk workflows.
Tool-call instrumentation: prove what the agent used
Tool calls need first-class telemetry. Log tool name, version, input arguments, output summary, raw error, duration, retry count, and external dependency status. Also record whether the result was actually used in the final answer.
That last field matters. A tool can succeed technically and still fail operationally if the agent ignores the result or uses it incorrectly.
Tie tool events, traces, and logs to the same correlation ID. Without that, debugging becomes slow and fragmented.
Trace Agent Decisions with AI Observability, Correlation IDs, and Full Execution Context
Most debugging falls apart at handoffs. You can find the prompt, the timeout, or the final answer, but not the sequence connecting them. The fix starts with one rule: every agent run needs a single trace_id that survives the entire journey.
Without that, your logs are just fragments. You may see the final prompt, a tool timeout, and a bad answer -- but not the chain that connects them. This is where agent observability usually breaks down. Teams think they have visibility because they can inspect prompts. Root cause often lives in the missing link between retrieval, tool output, and the decision that used -- or ignored -- both.
Use one trace ID to build a debuggable execution graph
A useful trace is not one event. It is a graph of spans tied to one correlation ID or trace ID. In practice, distributed tracing concepts fit AI systems well: create a parent span for the user request, then child spans for planner output, retrieval, tool calls, handoffs, retries, guardrail checks, and final response assembly.
A failed run might look like this:
trace_id=8f3c...- span:
request_received - span:
planner_step - span:
vector_retrieval - span:
tool_call.crm_lookup - span:
retry.tool_call.crm_lookup - span:
guardrail_policy_check - span:
final_response
Now you can see the story. Retrieval returned stale chunks. The CRM tool retried and timed out. The planner still produced a confident answer from partial context. No exception. Still a failure. This is why LLM tracing must connect decisions, not just events.
Capture the context that changes behavior
A trace without context is only half useful. If you do not capture execution context, AI debugging workflows stall fast.
Record prompt versioning, system prompt hash, memory state, retrieved chunks and their metadata, session metadata, model parameters, token counts, guardrail outcomes, retry counts, and external dependency state such as vector index version or upstream API status. Behavior changes often come from context drift, not code changes.
Logs without context tell you what happened. Context tells you why.
There is a tradeoff: full capture can raise storage cost and privacy risk. So be deliberate. Store references or hashes for sensitive payloads, redact user data, and keep request scoping consistent across services. For AI agent monitoring, missing context makes root-cause analysis impossible even when the logs exist.
Failure Patterns, Metrics, and Alerting for AI Agent Monitoring
By the time users complain, the pattern has usually been there for a while. The infrastructure may look healthy the whole time. That is why effective AI agent monitoring needs to turn traces into failure signals you can actually alert on.
Common patterns repeat: tool loops, retry storms, retrieval misses, context truncation, hallucinated final answers after tool timeouts, policy violations, and quiet degradation through latency or cost spikes. Detect these from spans such as planner, retrieval, tool_call, and final_response, plus fields like trace_id, prompt version, model name, token counts, retry count, tool status, and retrieved document IDs. If a tool times out and the agent still returns a confident answer, that is not success. It is a hidden failure. The same applies when the agent finishes, but uses the wrong tool, cites weak retrieval, or takes far more steps than normal.
Track symptom metrics and root-cause signals separately. For user impact, monitor task success rate, abandonment rate, p95 latency, token burn, and SLO compliance. For diagnosis, pair them with step failure rate, tool error rate, timeout frequency, retrieval quality checks, fallback frequency, and unusual pathing such as repeated retries or unexpected tool sequences.
Monitoring is as important as deployment -- because silent failures get expensive before they become obvious.
Alert on sustained drift, not every blip. A practical setup uses threshold alerts for tool error bursts, latency, and cost spikes, plus anomaly alerts for excessive step count, retry growth, or shifts in normal execution paths. Tune thresholds against real run history so operators can distinguish a noisy run from a systemic failure pattern.
AI Debugging Workflows: Best Practices and Common Mistakes
When a bad answer reaches production, do not start with the answer text alone. Start with the run. The useful workflow is straightforward: reproduce the failure, trace the full execution with a correlation ID, and verify where the agent drifted across planning, retrieval, tool use, and answer generation.
Start by reproducing the failing run in a controlled environment, then inspect the planner output first. If the plan is wrong, downstream evidence is less useful. Next, compare retrieved context — document IDs, chunk metadata, scores — with tool inputs and prompt state. Then check retries, timeouts, and fallback behavior to see whether a slow or partial tool response changed the path. Finish by checking grounding: did the final answer actually use retrieved evidence, or did the model fill gaps on its own?
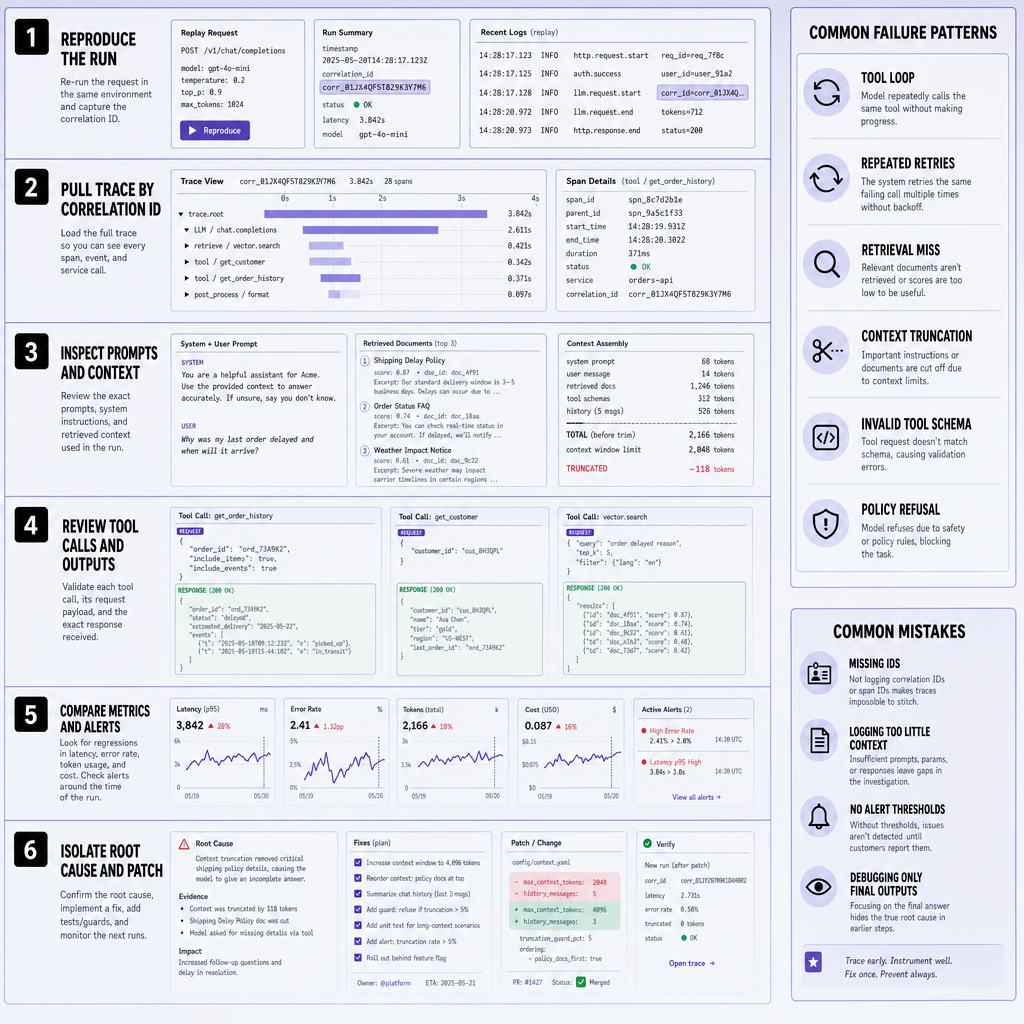
Use a runbook that captures prompt version, model version, orchestration graph version, tool schema version, and guardrail policy at run time. Keep environments comparable; if staging uses different prompts, tools, or retrieval settings, trace comparisons are weaker. Plan for tradeoffs too: full-fidelity traces improve diagnosis, but they increase cost and privacy risk, so sampling and redaction should be deliberate defaults.
Common mistakes are predictable: debugging only final outputs, storing unstructured logs, skipping task-level success metrics, and treating incident review as blame instead of system design. After each failure, make at least one concrete system change, such as adding instrumentation, tightening guardrails, or adjusting orchestration, so the same invisible failure is less likely to repeat.
Frequently Asked Questions
What is the difference between AI observability and standard application monitoring?
AI observability explains how an agent reached an outcome, while standard monitoring mainly reports system health such as uptime, latency, and error rates. The difference matters because many agent failures happen inside planning, retrieval, and tool selection even when every service appears healthy.
How does AI observability help reduce mean time to resolution for agent incidents?
AI observability reduces mean time to resolution by linking prompts, tool calls, retrieval results, model settings, and final outputs under one trace. That lets engineers move directly from a bad response to the exact step where behavior drifted, instead of manually stitching evidence across disconnected systems.
Why should AI agent monitoring include business metrics, not just technical metrics?
AI agent monitoring should include business metrics because users care about task completion, correctness, and trust, not just low latency. A fast agent that produces wrong answers is still failing. Business metrics reveal whether technical issues are actually harming customer outcomes.
What is the best way to use correlation IDs in agent observability?
The best use of correlation IDs is to assign one immutable trace identifier at request start and propagate it through orchestration, retrieval, model calls, tool executions, caches, and downstream APIs. That creates a single execution record, which is essential when one user-visible failure spans multiple components.
How can teams prioritize what to instrument first in LLM tracing?
Teams should instrument the highest-risk and highest-cost paths first, especially external tool calls, retrieval steps, planner decisions, and fallback logic. Those areas usually create the hardest-to-explain failures and the biggest operational impact, so they deliver the fastest return on observability effort.
Make Imversion a preferred source on Google
Like this kind of AI and software analysis? Add Imversion as a preferred source so Google can highlight our articles for you in Search, AI Overviews, and AI Mode.