LLM Observability: Key Metrics for Production AI Performance Monitorin
Unlock effective LLM observability with key metrics like latency and errors. Learn best practices for reliable AI monitoring in production systems.

LLM Observability for Production AI Apps: What Engineering Teams Should Track
Your AI endpoint can return 200 OK all day and still fail users. Responses get slow, token costs creep up, retrieval goes weak, tool calls break, and the model delivers polished nonsense with complete confidence. If you want reliable AI observability in production, you need visibility into why responses are slow, expensive, broken, or wrong.
LLM Observability Key Takeaways
- Track the full production path -- latency, token usage, cost, errors, hallucinations, and user feedback -- because AI observability fails if you watch uptime but miss bad answers or runaway spend.
- Use logs, traces, and correlation IDs together. Logs show events; traces expose where a RAG pipeline, tool call, or agent step slowed down or broke.
- Build AI monitoring dashboards and alerts around real failure modes: timeout spikes, token growth, parsing failures, and quality drops.
- Treat LLM observability as continuous optimization. Monitoring is as important as deployment, especially when prompts, models, and traffic patterns keep changing.
Why LLM Observability Matters for Production Reliability
Engineering teams need LLM observability because a healthy service can still deliver a failed AI experience.
Traditional monitoring tells you whether your API is up, your pods are running, and your database is responding. Useful, yes. Sufficient, no. Generative systems fail in ways standard application metrics do not capture: slow first-token response, runaway token consumption, broken tool calls inside agent workflows, weak RAG retrieval, and answers that sound polished but are wrong. The app responded. But the AI feature did not work.
That gap changes what “production-ready” means.
Uptime is not the same as usefulness
A conventional service can meet infrastructure SLIs and still miss the product outcome. CPU, memory, request rate, and 200-status counts may look clean while users wait too long for a response or receive low-quality output. That gap is where AI observability and AI monitoring become operational requirements, not nice-to-haves.
Consider a support chatbot. The API returns 200. No container restarts. No database alarms. But inference latency climbs, time to first token feels sluggish, prompts expand due to extra conversation history, and token-based cost spikes. Worse, the model answers confidently with unsupported claims because retrieval returned weak context. From an infrastructure view, the system is healthy. From the user’s view, it is unreliable.
Production reliability for LLM apps includes speed, cost predictability, and answer quality -- not just uptime.
LLM systems create a new production gap
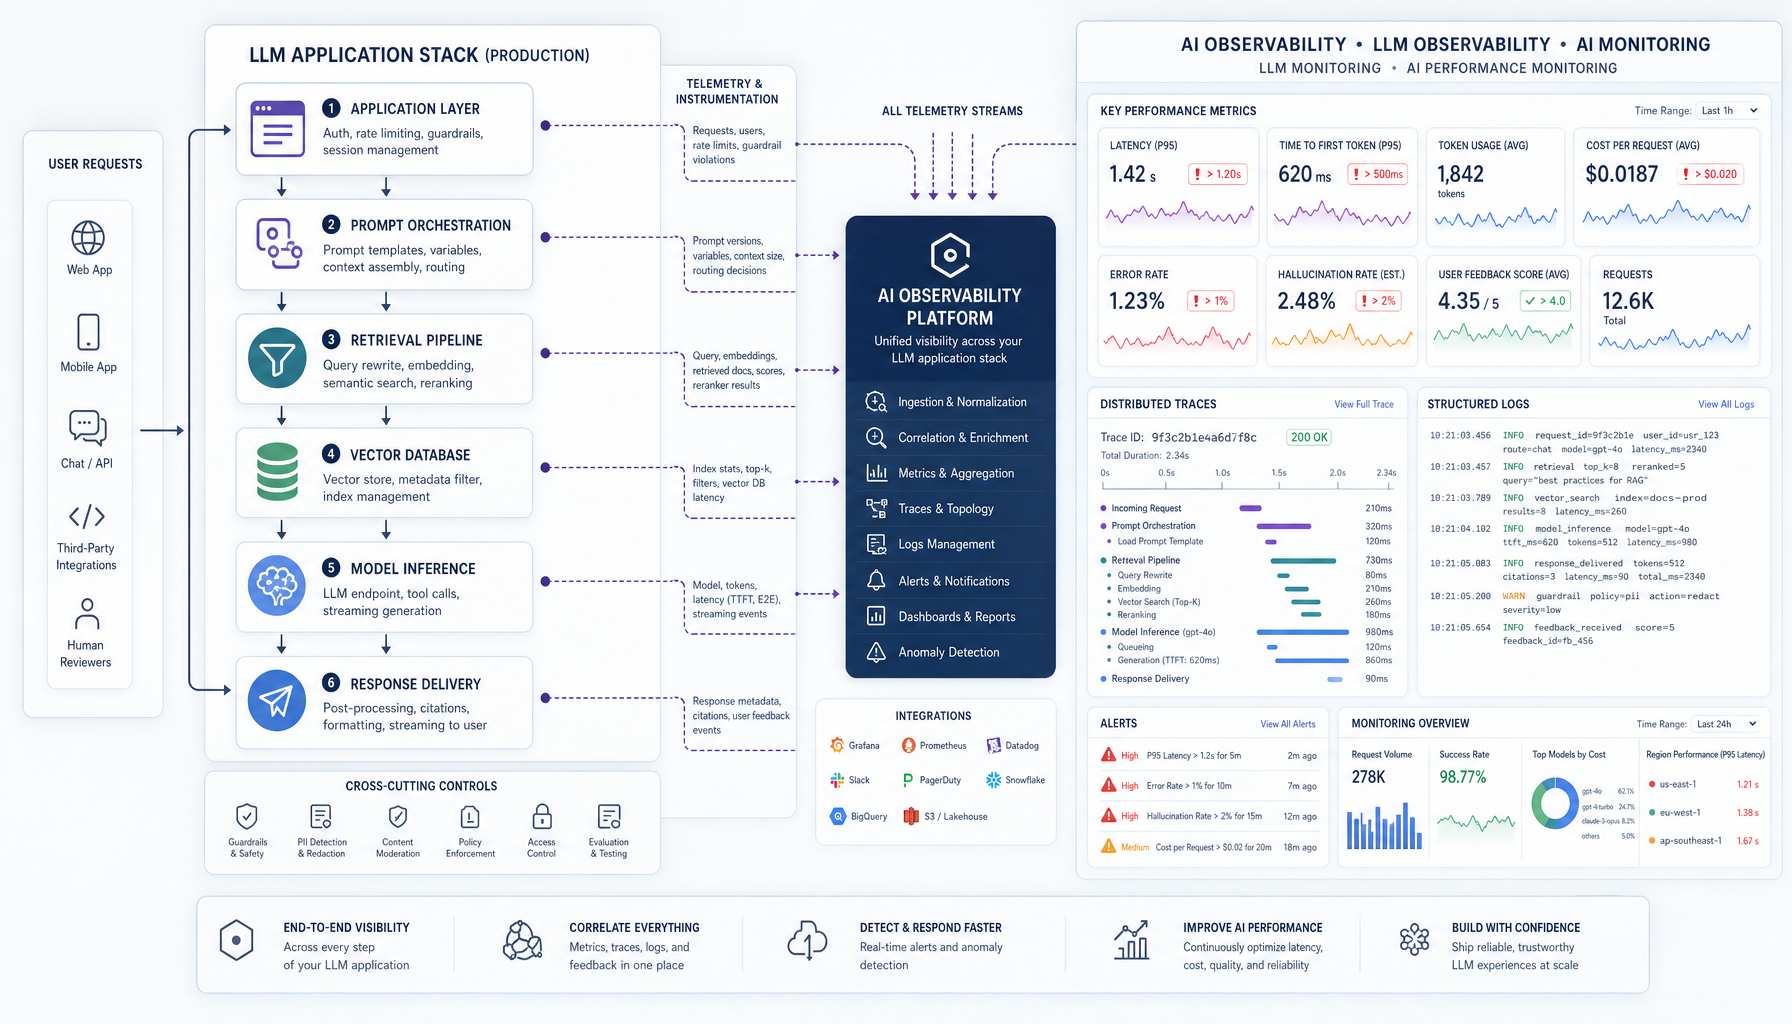
LLM applications add moving parts that standard dashboards rarely connect: prompt templates, model versions, RAG pipelines, tool execution, guardrails, and user feedback loops. Teams need LLM monitoring that ties traces, logs, and evaluation signals to business-facing SLOs.
A practical recommendation is to define SLIs beyond availability. Track inference latency, time to first token, prompt and completion tokens, cost per workflow, tool-call failure rate, and quality signals such as hallucination flags or negative user feedback. Monitoring is as important as deployment because production issues often appear after release, inside real prompts and real traffic patterns.
Without that visibility, teams debug blind.
And blind systems get expensive fast.
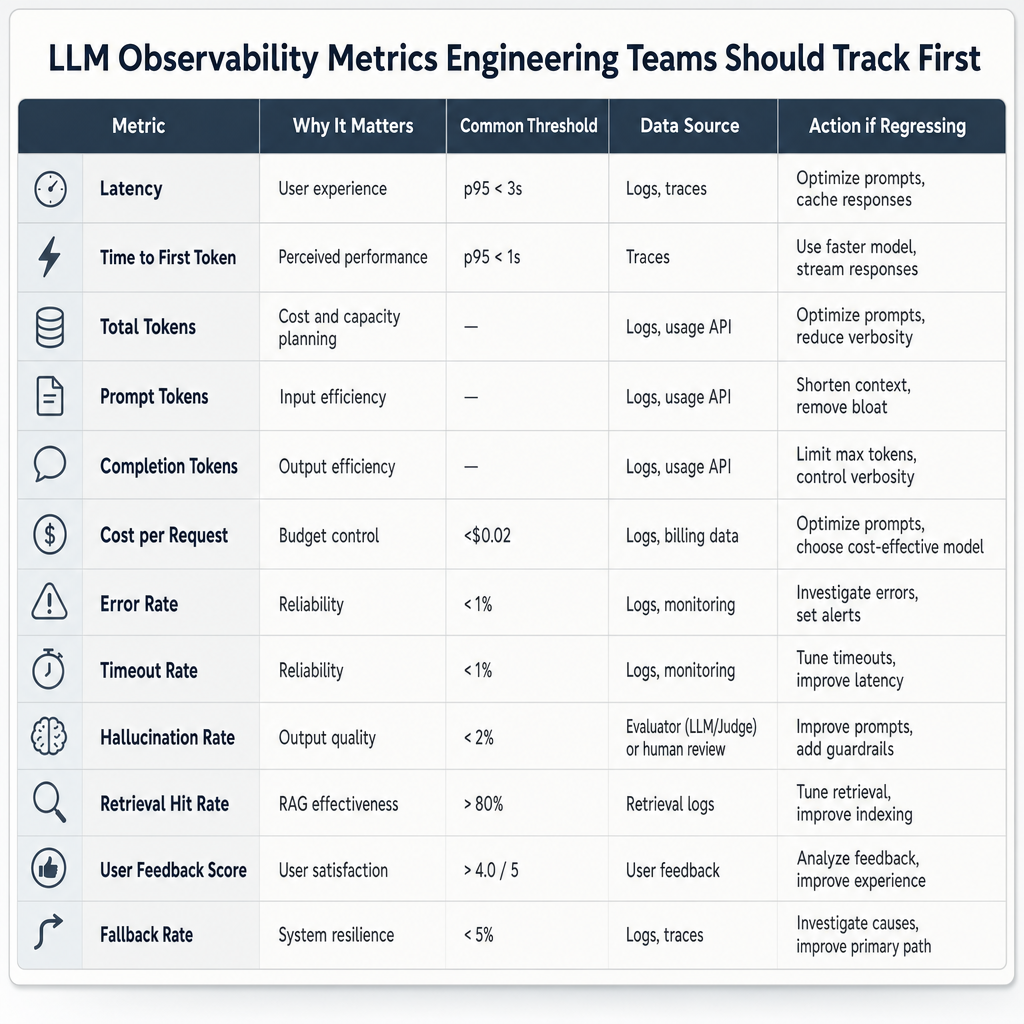
LLM Observability Metrics Engineering Teams Should Track First
Most teams make the same mistake early: they either track almost nothing, or they build a giant quality framework nobody trusts. Neither helps in production. Start with a small metric set that helps you operate the system. For effective LLM monitoring in production, the first metrics should cover speed, spend, failures, and answer quality together. Anything less leaves blind spots.
The core metric set
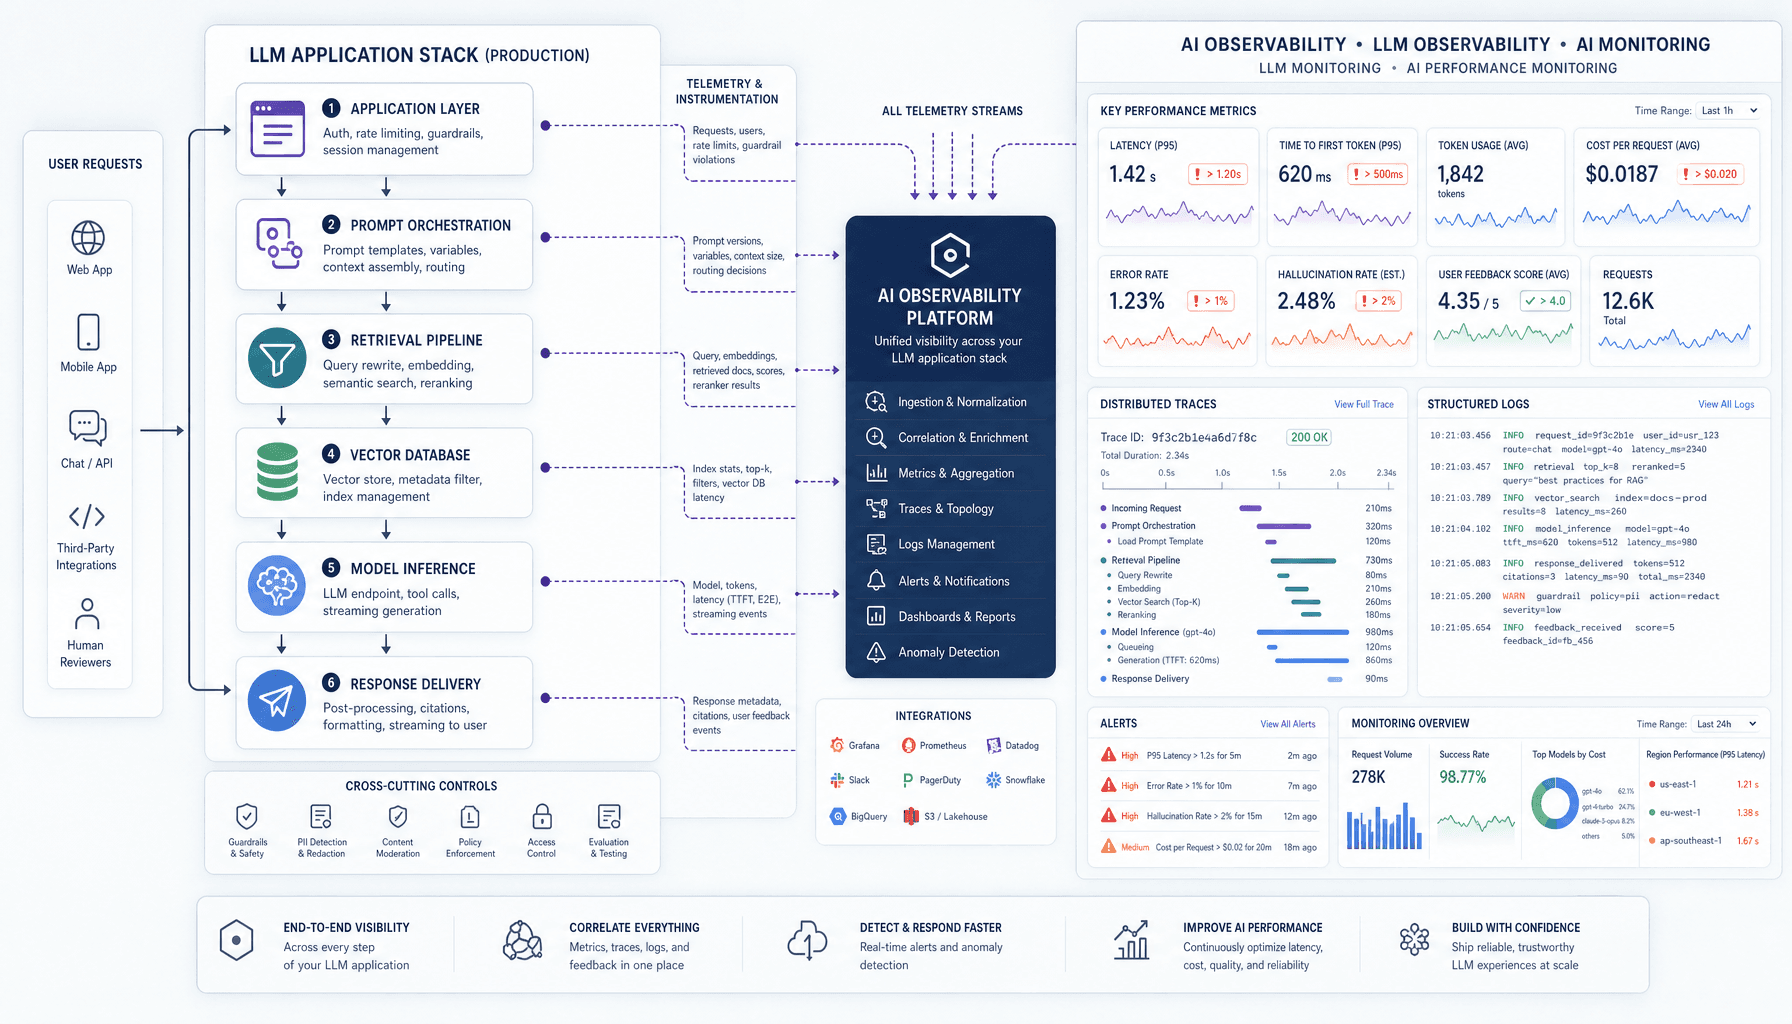
Track latency, time to first token, and total response time first. They answer different questions. Time to first token shows how quickly the model begins responding in chat or copilot workflows. End-to-end latency shows what the user actually experiences across retrieval, orchestration, tool calls, and generation. Segment both by model, feature, customer tier, and workflow step.
Next, track token usage: prompt tokens, completion tokens, and total tokens per request. This is basic LLM observability. It tells you whether prompts are bloated, retrieval is over-stuffing context, or completions are running too long. Token usage should always be tied to cost per request. If a support assistant uses 2x the prompt tokens after a prompt change, your spend rises even if traffic stays flat.
Monitor error rate and timeout rate next, but break them down. A generic “request failed” metric is weak. Separate provider API failures, rate limits, schema parsing errors, guardrail blocks, and tool-call failures in agent flows. In practice, a healthy model call can still produce a broken user experience because the downstream tool invocation failed.
Quality metrics need correlation
Quality is harder. Still, you should track it early.
Use hallucination flags, lightweight evaluation scores, unsupported-claim checks, and user feedback signals such as thumbs down, regenerate rate, or human escalation. Do not read these in isolation. Correlate them with model version, retrieval hit quality, token counts, and latency. A spike in hallucinations after context truncation is a very different problem from a spike after swapping models.
Monitoring is as important as deployment -- because production AI systems usually fail as a chain, not as a single event.
Metrics alone are not enough, though. For strong AI observability and LLM application monitoring, combine them with request logs, traces, correlation IDs, and alerts. That is how AI performance monitoring becomes actionable instead of cosmetic.
Logs, Traces, Alerts, and Dashboards That Make LLM Observability and AI Monitoring Actionable
If your team only knows that the endpoint returned 200 OK, your AI monitoring is incomplete.
You need telemetry that explains what the model saw, what it did, what it called, what it cost, and why it failed. Start with structured logging. Log each request with a correlation ID, model and provider, model version, prompt template ID, prompt and completion token counts, latency, finish reason, safety outcome, cache hit status, and user or session scope. For RAG or agent systems, add retrieval query, document IDs, reranker result, tool name, tool arguments, tool latency, and parser outcome. Structured logging beats raw text dumps every time -- too much unstructured prompt logging creates compliance risk, storage bloat, and miserable debugging.
Security cannot be optional here. Apply PII redaction before logs leave the app, and store only the fields you actually need for LLM monitoring.
Trace the full request path
Logs show events. Distributed tracing shows causality.
Use OpenTelemetry spans across the full pipeline: API gateway, orchestration layer, retrieval step, model call, tool execution, validation, and response post-processing. In multi-step workflows, traces make slowdowns obvious. You can see whether p95 latency came from vector search, a second model retry, or a stuck tool call. For agent workflows, nested spans and correlation IDs turn “the assistant is slow” into a debuggable incident.
Alert on patterns, not noise
Set alert thresholds around operational risk:
- p95 latency spikes by endpoint or model
- error bursts from provider failures, timeouts, or JSON parsing issues
- token-cost anomalies by feature, customer tier, or agent path
- retrieval failure rates and tool-call success rates
- safety or policy violation jumps
Do not alert on every single bad response. Quality still needs review loops, not pager fatigue.
Build dashboards for different decisions
A single dashboard is usually a bad dashboard.
Your dashboards should slice by model, endpoint, feature, region, and customer tier. Engineering needs latency, error rate, and trace drill-downs. Product needs usage, feedback, and cost per workflow. Operations needs alert status, spend trends, and provider health. That is how AI performance monitoring becomes useful in production -- visible, segmented, and tied to action.
Best Practices and Common Mistakes in LLM Monitoring
Observability is much easier to build before production pain forces the issue. Strong LLM monitoring starts before launch, not after the first incident. You do not need a perfect observability model on day one, but you should instrument production-critical workflows first: the chatbot handoff, the RAG answer path, or the agent tool-call chain.
Best practices that actually hold up in production
Establish baselines early. Capture latency percentiles, token usage, cost per workflow, error rates, and initial quality signals before traffic scales. Without baselines, AI monitoring becomes reactive.
Segment telemetry by model, prompt version, customer tier, and workflow step. Blended dashboards hide regressions. A slow reranker, an oversized system prompt, or one agent loop can skew the whole picture.
Set budget and quality guardrails. Alert on token spikes, repeated tool failures, fallback model usage, and drops in automated evaluation scores. Also protect sensitive data by redacting logs and limiting access to prompts and outputs.
Pair automated evaluation with human review. Automated checks help you spot drift at scale, while human review catches nuance, unsafe phrasing, and business-context failures.
Close the loop with user feedback. Retries, abandonment, escalation events, and simple approval signals often expose issues before internal metrics do.
Richer traces improve diagnosis, but they also add storage, labeling, and engineering overhead.
Common mistakes that quietly break observability
Teams often treat hallucinations as only a model problem. In practice, retrieval gaps, stale documents, prompt regressions, and broken tool outputs can all produce bad answers.
Other recurring mistakes:
- tracking averages instead of percentiles
- ignoring prompt and model versioning
- shipping alerts that do not map to business impact
- collecting logs without correlation IDs or traces
- measuring cost globally instead of per feature or workflow
That pattern shows up often: teams are not missing data, they are missing the signals that explain failure.
How to Use AI Observability for Continuous Optimization
Dashboards are not the goal. Better production behavior is. Use observability data to guide releases and targeted fixes, not just to populate dashboards. A useful optimization loop connects prompt behavior, retrieval quality, routing decisions, latency, token usage, errors, cost, and user feedback so teams can see which change actually improved production outcomes.
Review recurring signals first: latency by workflow, token growth, cost per task, error spikes, and feedback trends. Then inspect traces for the worst paths, such as a slow RAG answer, a failed tool call, or a response with high token burn and poor ratings. Broad prompt rewrites often create churn; targeted fixes are easier to validate.
If traces show slow context assembly or weak grounding, tune retrieval first by adjusting chunking, top-k, reranking, or source filtering. If one intent is expensive without clear quality gains, change model routing so simpler requests use a cheaper model and escalations use a stronger one. If repeated prompts reliably produce the same output, add caching where it is safe and measurable.
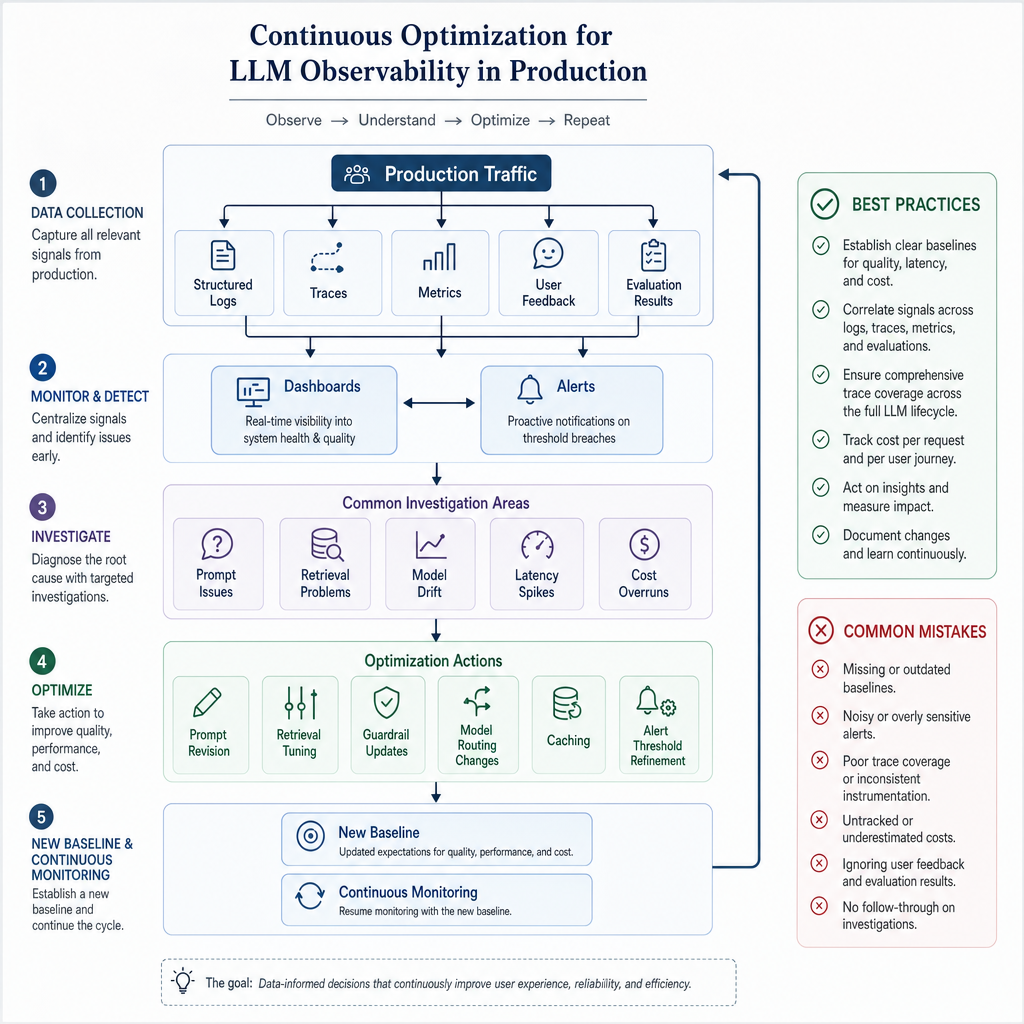
Before each release, compare prompt versions, retrieval changes, and model settings against a stable test set and production baselines. Set alerts for cost jumps, latency regressions, and clustered failures so monitoring supports incident response as well as optimization.
Review weekly, ship small changes, and measure the result before touching the next layer.
FAQs
1. How does AI observability improve LLM app quality over time?
It ties telemetry, traces, and feedback to specific prompt, retrieval, routing, and caching changes.
2. What should teams review first in AI monitoring data?
Start with latency, token usage, cost, errors, and user feedback by workflow.
3. Can LLM observability reduce cost without hurting quality?
It can help identify expensive paths, route simpler tasks to cheaper models, and support safe caching decisions.
4. How does observability help with release regression checks?
It lets you compare new prompts, models, and retrieval settings against baseline quality, latency, and cost.
5. What is the biggest mistake in LLM application monitoring?
Watching aggregate uptime while missing bad answers, token spikes, and broken traces in real user flows.
Frequently Asked Questions
What is AI observability in an LLM application stack?
AI observability is the practice of collecting and connecting metrics, logs, traces, and feedback signals across prompts, retrieval, model calls, tools, and outputs so teams can explain system behavior in production. It goes beyond uptime monitoring by showing how response quality, latency, and cost change at each step of an LLM workflow.
How does LLM observability help with incident response during production outages or degradations?
LLM observability helps incident response by revealing whether a failure started in retrieval, model inference, tool execution, output validation, or provider instability. With correlated traces and structured logs, engineers can isolate the exact failing stage, estimate customer impact faster, and apply targeted mitigations instead of rolling back blindly.
Why should teams separate AI monitoring for development from production monitoring?
Development monitoring is useful for experimentation, but production monitoring must reflect real traffic, real prompt variation, and actual user outcomes. A system that looks stable in testing can fail under live concurrency, segment-specific usage, or provider variance, so production telemetry needs stricter alerting, stronger baselines, and clearer ownership.
What should a good LLM observability dashboard include for engineering leaders?
A strong LLM observability dashboard for engineering leaders should combine service health with model behavior: p95 latency, time to first token, token growth, cost per workflow, tool success rate, retrieval quality, feedback trends, and release comparisons. It should also allow segmentation by model, prompt version, customer tier, and feature to expose regressions quickly.
How can AI performance monitoring support compliance and governance?
AI performance monitoring supports compliance and governance by enforcing data minimization, tracking which models and prompts handled a request, recording safety outcomes, and showing whether policy checks were bypassed or triggered. When paired with redaction and access controls, it creates an auditable operational record without storing unnecessary sensitive content.
Make Imversion a preferred source on Google
Like this kind of AI and software analysis? Add Imversion as a preferred source so Google can highlight our articles for you in Search, AI Overviews, and AI Mode.