AI Agent Monitoring: Essential Insights for 2026
Discover the importance of AI agent monitoring including logs, traces, and user feedback to ensure optimal performance and continuous improvement.

How AI Agent Monitoring Works After Launch
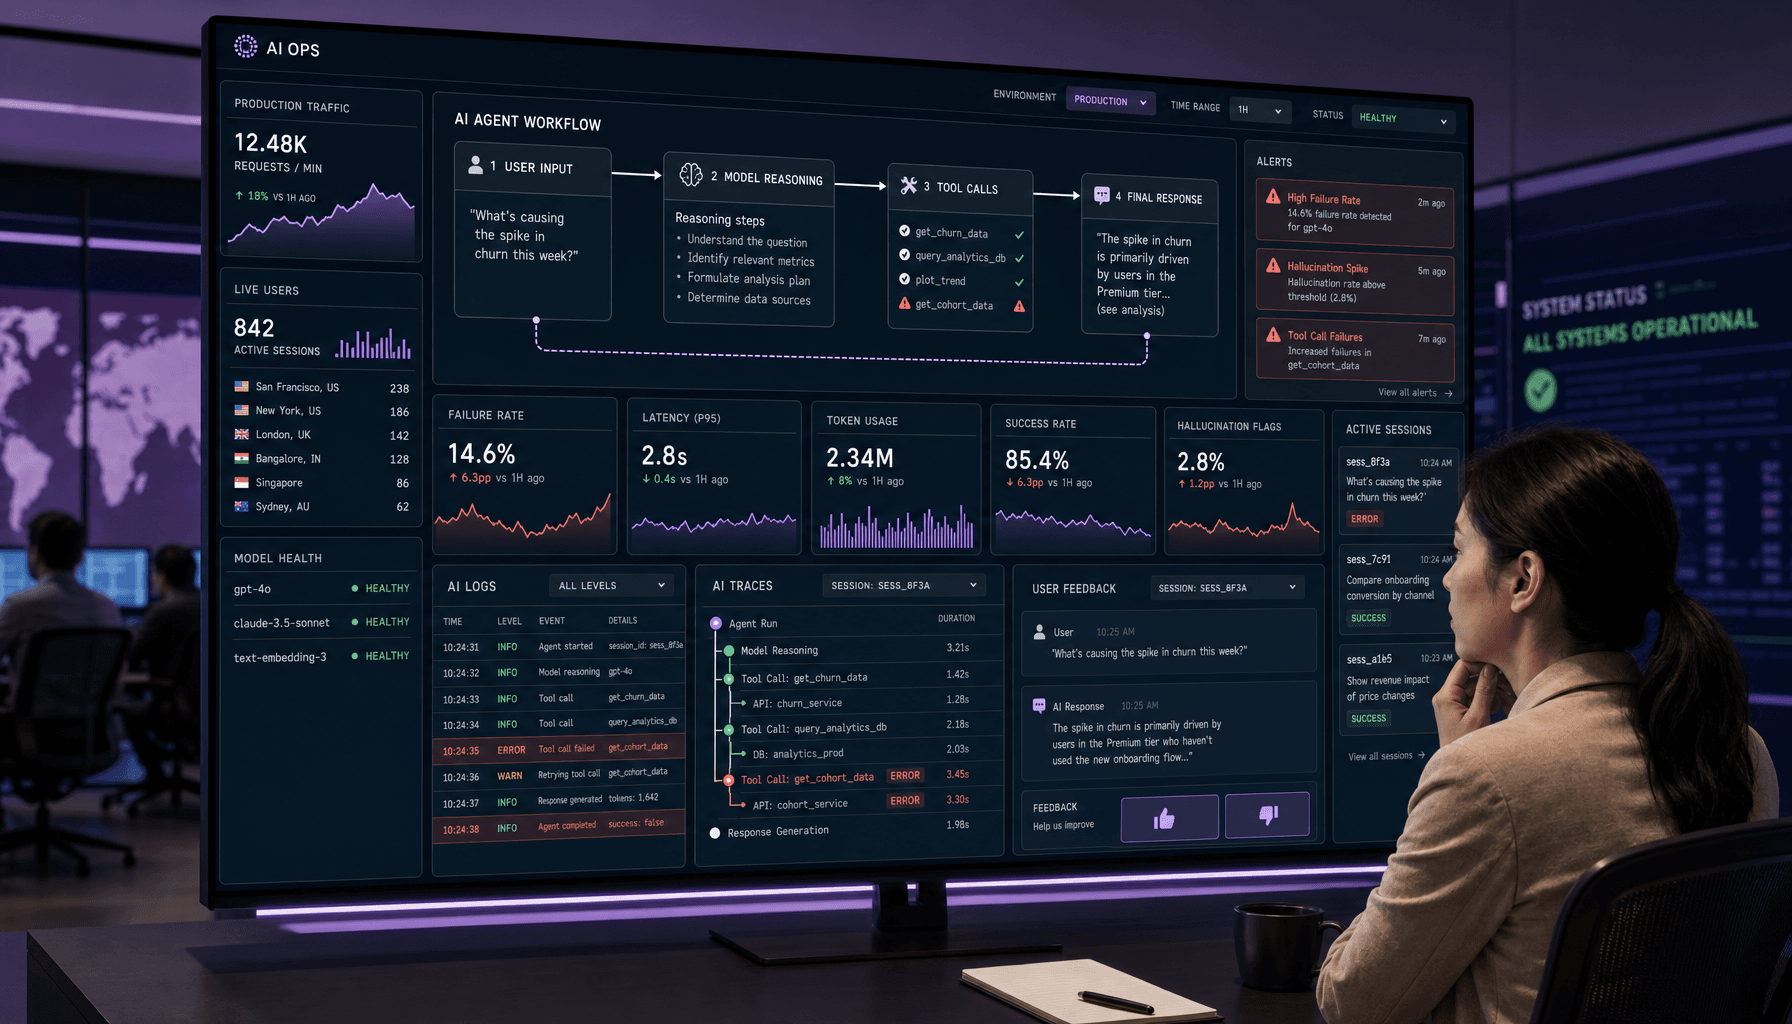
You usually find out an AI agent is “working” right up until users start getting wrong answers, tools fail halfway through a workflow, or latency jumps for reasons your uptime dashboard never shows. A healthy endpoint does not tell you whether the agent made a bad decision, hallucinated, or quietly drifted in production.
AI Agent Monitoring Key Takeaways
- Treat AI agent monitoring as a production discipline, not a launch checklist. It helps you catch hallucinations, latency spikes, broken retrieval, and model regressions before they turn into user-facing incidents.
- Use AI logs for raw event visibility -- prompts, tool calls, token usage, errors, and model versions. Use AI traces to follow the full request path across planning, retrieval, and tool execution.
- Collect AI feedback from users and internal reviewers because runtime success can hide quality failures. A response may complete cleanly but still be wrong, unsafe, or unhelpful.
- Strong AI observability needs alerting tied to real signals like failure rate, timeout spikes, and tool-call errors. Monitoring is as important as deployment.
- Keep improving after launch. Review failures, tune prompts and retrieval, compare model versions, and fix noisy alerts so production monitoring stays useful.
Why AI Agent Monitoring Matters in Production
Pre-launch testing is necessary. It is not enough.
Your AI agent will behave differently once real users, messy prompts, rate limits, stale data, and external API failures hit the system at the same time. Demos are controlled. Production is not. That gap is why AI agent monitoring has to be treated as an operational requirement, not a post-launch nice-to-have.
In practice, AI observability means you can answer hard production questions quickly: What did the agent see? Which tool did it call? Did retrieval-augmented generation return weak context? Did a timeout force a fallback? Which model version increased latency or token usage? Without that visibility, debugging turns into guesswork.
This gets sharper with multi-step agents. A small issue can cascade. For example, a retrieval call returns incomplete documents, the agent plans around bad context, then a downstream tool calling step fails on a malformed parameter, and the user only sees a confident but wrong answer. Your uptime dashboard may stay green while trust drops quietly.
And trust is expensive to rebuild.
Monitoring in production protects more than reliability. It also protects cost, compliance, and change safety. If token usage spikes because the agent retries a failing tool three times, you need to see it. If prompts or outputs contain sensitive fields, you need controls around what enters your AI logs. Security should not be optional -- especially when agents touch customer data, internal tools, or external systems.
A practical starting point is a minimum viable monitoring layer: structured AI logs, request traces with OpenTelemetry, basic alerts on latency and tool-call failure rate, and human review for sampled outputs. Teams at places like Imversion Technologies Pvt Ltd often run into the same lesson early -- silent failures are harder and more expensive to debug later than adding instrumentation at launch.
There is a tradeoff, of course. Deep AI performance monitoring adds setup overhead, storage cost, and process discipline. Shallow monitoring leaves you blind to hallucinations, regressions, and workflow breakage. Start lean. Instrument the critical path first. Expand coverage as real failure patterns emerge.
Use AI Logs and AI Traces to See Every Step for AI Agent Monitoring
If an agent fails in production and you cannot reconstruct the request path, you are stuck guessing whether the problem came from retrieval, orchestration, a tool, the model, or your own fallback logic. That is why logs alone are not enough.
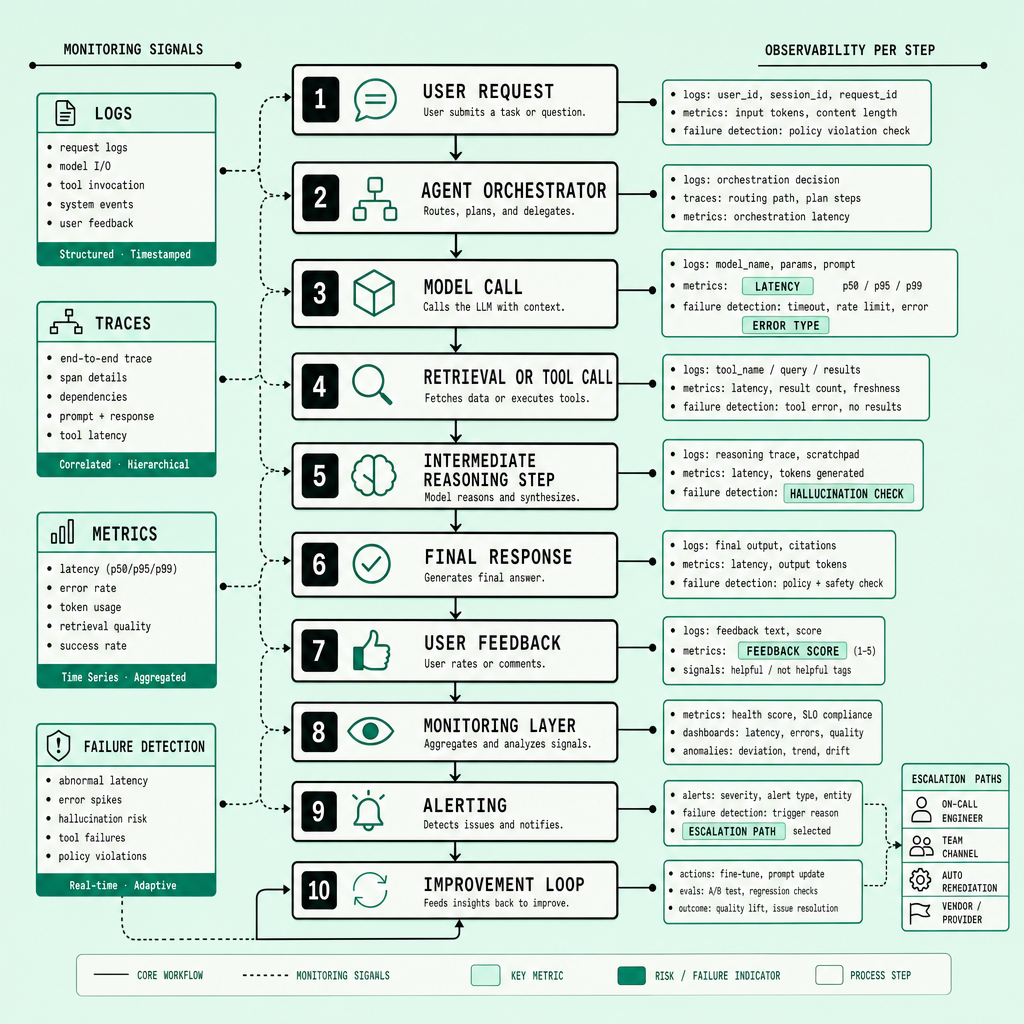
To debug an AI agent in production, you need both AI logs and AI traces: logs capture individual events, while traces connect those events across one request path so you can see where a workflow broke.
Capture raw events with structured AI logs
AI logs should record decision-relevant events, not every possible detail. In multi-step agents, too much logging quickly becomes noise. Focus on fields that help explain behavior, such as prompt or prompt hash, response, tool name, tool input or output summary, latency, token usage, error type, safety result, model version, timestamp, and session ID.
Use a consistent schema so events can be filtered and compared. JSON is a practical default. If you already use OpenTelemetry across services, align AI log fields with that broader telemetry setup. During incident review, logs without a session ID, request ID, or model version are much harder to use.
Security matters here too. Redact or hash sensitive prompts, user identifiers, secrets, and retrieved content before logs leave the runtime. If you keep full prompts and responses for evaluation, store them separately from operational logs and restrict access.
Use AI traces to map the full workflow
Logs show what happened at each step. Traces show how those steps fit together.
That distinction matters because a single user request can trigger retrieval, reranking, planning, multiple tool calls, retries, validation, and final generation. If something fails, the root cause is often in the handoff between components rather than in one isolated event.
Model each major step as a trace span, such as user request, retrieval call, LLM completion, tool execution, validation, and response assembly. If your stack already supports distributed tracing, use the same trace context for agent steps so application and AI failures can be investigated together.
For example, an agent may return a wrong answer to a billing question. A log might show a retrieval timeout and a fallback response. The trace can show the full path: delayed search, retry, timeout, fallback generation, then final response. That makes it easier to separate retrieval failures, orchestration problems, and model behavior.
What teams should capture
At minimum, link AI logs and AI traces with:
- session ID
- request ID
- trace ID and span IDs
- model and prompt version
- timestamps and per-step latency
- tool-call status and error codes
- token usage and cost fields
- redaction status for sensitive data
This makes AI performance monitoring explainable, not just measurable.
Monitor AI Feedback, Failures, and Hallucinations Before Trust Drops
The hard part is not spotting obvious outages. It is catching the failures that look fine on the surface: a polished answer built on bad context, a tool failure hidden by fallback text, or a response users stop trusting long before they file a complaint.
Do not wait for complaints to tell you an AI agent is failing. In production, trust often drops before uptime dashboards move, so monitoring should connect user feedback, failure signals, and model behavior in one workflow.
Turn AI feedback into operational data
Users usually report symptoms, not root causes. “This answer looks wrong” might mean failed retrieval, a timeout that triggered a fallback, a safety block, or a model-version regression.
Collect feedback in a structured way. Thumbs-up and thumbs-down help, but negative ratings are more useful when paired with issue tags such as wrong answer, unsupported claim, stale data, tool failure, policy violation, slow response, or unclear output. Then link that feedback to session ID, trace ID, model version, prompt template, retrieved documents, and tool-call results in your observability pipeline.
This matters because standard metrics can look healthy while answer quality slips. Fast responses and good success rates do not prove the output was correct.
Detect failures before they spread
Hallucinations and silent workflow failures are risky because they often look complete.
Use automated checks for:
- unsupported claims without evidence
- broken action chains where a tool step fails but the model continues
- low-confidence outputs after retrieval misses or empty tool results
- policy violations flagged by safety filters
- fallback responses firing too often
- spikes in tool-call failures, timeouts, or review-queue volume
Set review queues for high-risk cases such as refunds, account actions, medical guidance, legal guidance, or outputs with missing evidence. Automated checks help you find patterns at scale. Human review helps confirm whether the response was acceptable in context.
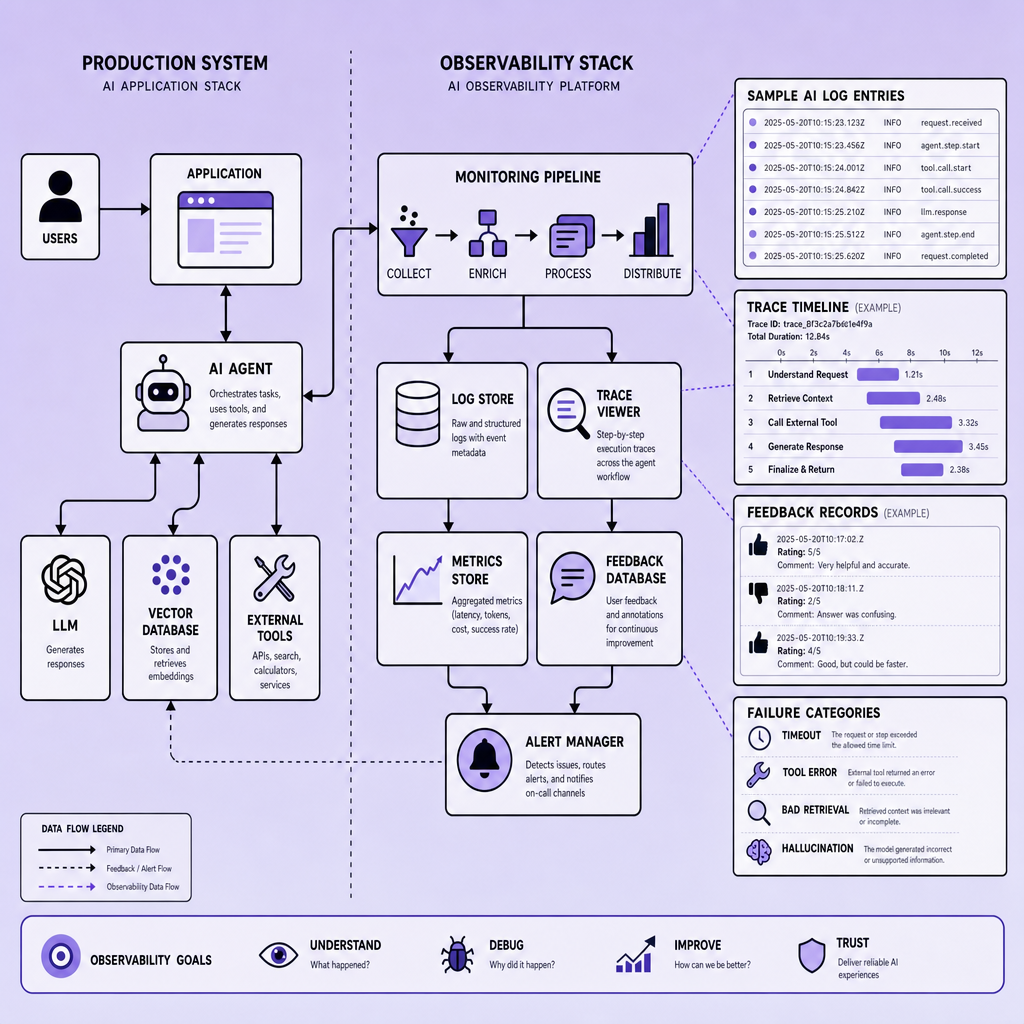
Monitoring is as important as deployment because a shipped agent that cannot explain its failures will keep losing trust silently.
Best practices and common mistakes
Route low-confidence answers to safer fallbacks. Alert on model-version regressions. Sample conversations for manual audits. Do not treat feedback alone as ground truth; validate it against traces and AI logs before changing prompts, tools, or retrieval logic.
FAQs
What is AI feedback in AI agent monitoring?
AI feedback is structured user input such as ratings, tags, comments, and issue reports linked to runtime data for diagnosis.
How do teams detect hallucinations in production?
Use evidence checks, retrieval validation, safety filters, unsupported-claim detection, and human review for high-risk outputs.
Why are AI logs important for failure analysis?
AI logs show prompts, responses, tool calls, errors, latency, and model metadata needed to trace likely failure causes.
What failures should AI observability track?
Track hallucinations, retrieval misses, tool failures, policy violations, timeout spikes, fallback responses, and low-confidence outputs.
Can user feedback replace automated monitoring?
No. Feedback shows user pain, but observability and AI performance monitoring help identify the operational cause.
AI Agent Monitoring Metrics, Alerting, and Continuous Improvement
If your team tracks plenty of numbers but still misses the moment users start losing trust, the problem is not a lack of dashboards. It is poor signal selection.
Start small, but measure what breaks trust first.
For AI agent monitoring in production, the most useful metrics are the ones that connect user impact, system reliability, and cost. Track latency, success rate, cost per task, token usage, tool-call reliability, fallback rate, escalation rate, user satisfaction, and hallucination-related indicators in one dashboard. If those signals live in separate tools, your AI observability stays fragmented and incident response slows down.
Which metrics matter most
Latency should be split by stage: retrieval, model generation, tool execution, and end-to-end response time. Success rate needs a clear definition -- completed task, correct tool result, or accepted answer. Be strict. Loose definitions hide failure.
Token usage and cost per task show whether a prompt change, model swap, or retrieval bug is making the agent expensive without improving outcomes. Tool-call reliability is critical for agents that depend on search, CRM APIs, internal services, or databases. Watch timeout rate, retry rate, and invalid response rate. Then add fallback rate and escalation rate to show how often the agent avoids failure by degrading gracefully or handing work to a human.
Hallucination monitoring needs proxy signals. Use contradiction flags, unsupported-answer reviews, low citation coverage, repeated user corrections, and “answer rejected” feedback. Pair that with AI logs and AI traces in tools like OpenTelemetry, Langfuse, Datadog, Grafana, Prometheus, or Sentry so you can inspect the full path behind a bad answer.
Turn metrics into alerting
Metrics by themselves do not help much if nobody knows when to act or what action to take. Alerting is where monitoring becomes operational.
Use SLOs and a simple error budget. But avoid alert spam.
A practical setup is to page on sustained end-to-end latency spikes, sharp drops in success rate, tool-call failure bursts, or sudden fallback-rate increases before users hit a full outage. Example: alert if tool-call failures stay elevated across a rolling window while queue time and retries rise together. That catches degradation early.
Monitoring is as important as deployment -- because a fast release without actionable alerting just moves failure into production.
Build improvement loops
Dashboards and alerts are only useful if they change what the team does next.
Review a compact dashboard daily and run a weekly ops review for regressions, model-version changes, prompt drift, and expensive workflows. In practice, teams improve faster when they start with a small set of business-critical signals, then expand only after they prove they can act on alerts consistently. Too many alerts create fatigue. Too few delay response.
Best practices: tie every alert to a runbook, compare metrics across environments, and feed confirmed failures back into CI/CD evaluation sets.
Common mistake? Tracking everything except user dissatisfaction.
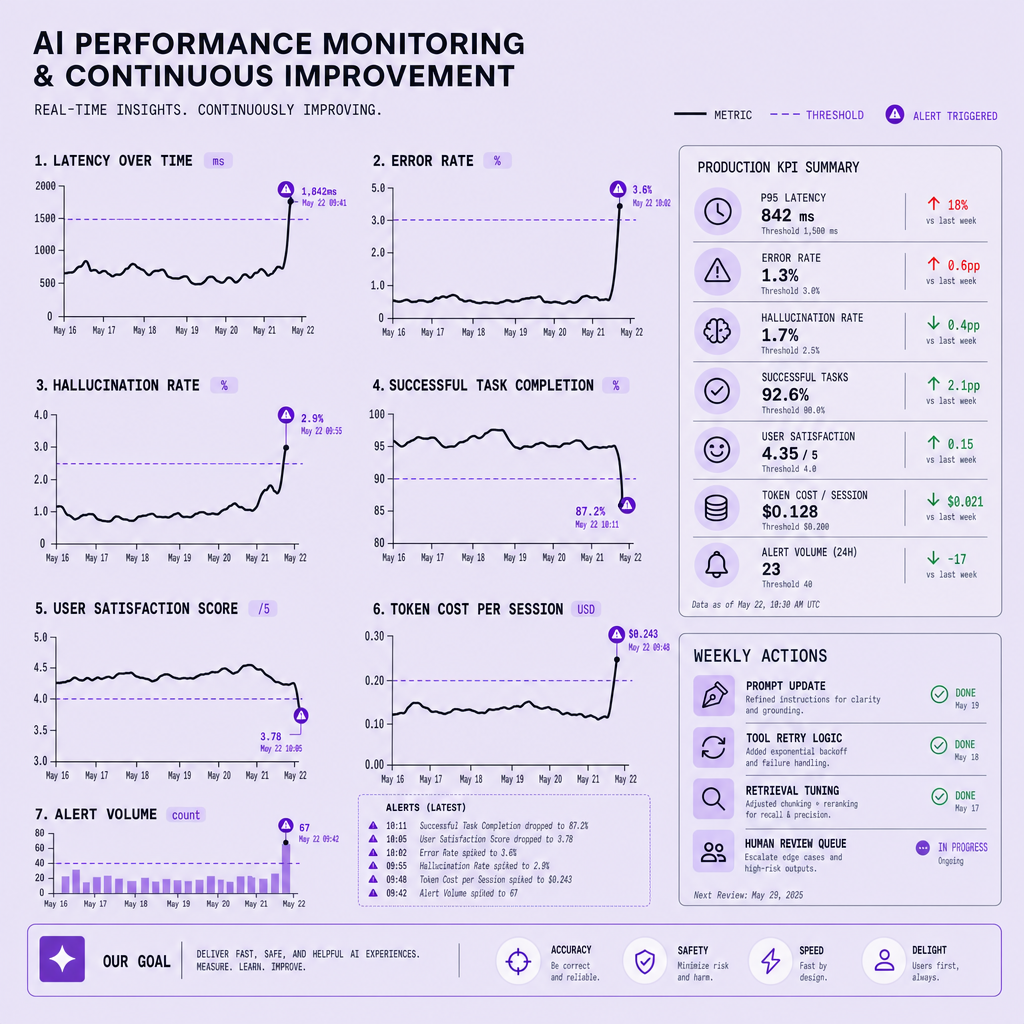
AI Agent Monitoring Is an Ongoing Reliability Practice
Launch is the starting line, not the finish. Strong AI agent monitoring depends on one connected production system: AI observability, AI logs, AI traces, feedback, failure detection, metrics, and alerting. In practice, use OpenTelemetry plus tools like Langfuse, Datadog, or Grafana to catch regressions early and keep improving behavior after release.
Frequently Asked Questions
What is AI agent monitoring actually measuring after launch?
AI agent monitoring measures more than uptime. It tracks request flow, tool behavior, response quality, latency, cost, user feedback, and failure patterns so teams can see whether an agent is useful, reliable, and safe in production.
How does AI observability differ from traditional application monitoring?
Traditional monitoring shows whether services are available and fast, while AI observability shows how the agent reasoned, what context it used, which tools it called, and why an output failed even when infrastructure looked healthy.
Why should AI agent monitoring include user feedback if logs already exist?
AI logs explain system behavior, but user feedback reveals whether the output solved the real task. Combining both helps teams distinguish technical success from actual user satisfaction and prioritize fixes that improve trust.
What are the best alerts to set for AI performance monitoring first?
The best starting alerts are sustained latency increases, rising tool-call failures, sudden fallback spikes, sharp drops in task success, and abnormal cost per task. These signals usually surface production issues before they become widespread incidents.
How often should teams review AI traces and failure data in production monitoring?
Teams should review critical alerts in real time, inspect AI traces during incidents, and run scheduled weekly reviews of failures, regressions, and feedback trends. A regular review cadence turns monitoring data into prompt, model, and workflow improvements.
Make Imversion a preferred source on Google
Like this kind of AI and software analysis? Add Imversion as a preferred source so Google can highlight our articles for you in Search, AI Overviews, and AI Mode.