AI Product Analytics: Essential Metrics for Success
After launch, AI product analytics must track key performance metrics in one dashboard to ensure success. Learn what to measure and why.

AI Product Analytics: What To Track After Launch
Launch day feels decisive. It isn’t. Once real users hit an AI feature, the hard questions start: are they getting value, is the system reliable, is quality holding up, and does the cost still make sense as usage grows?
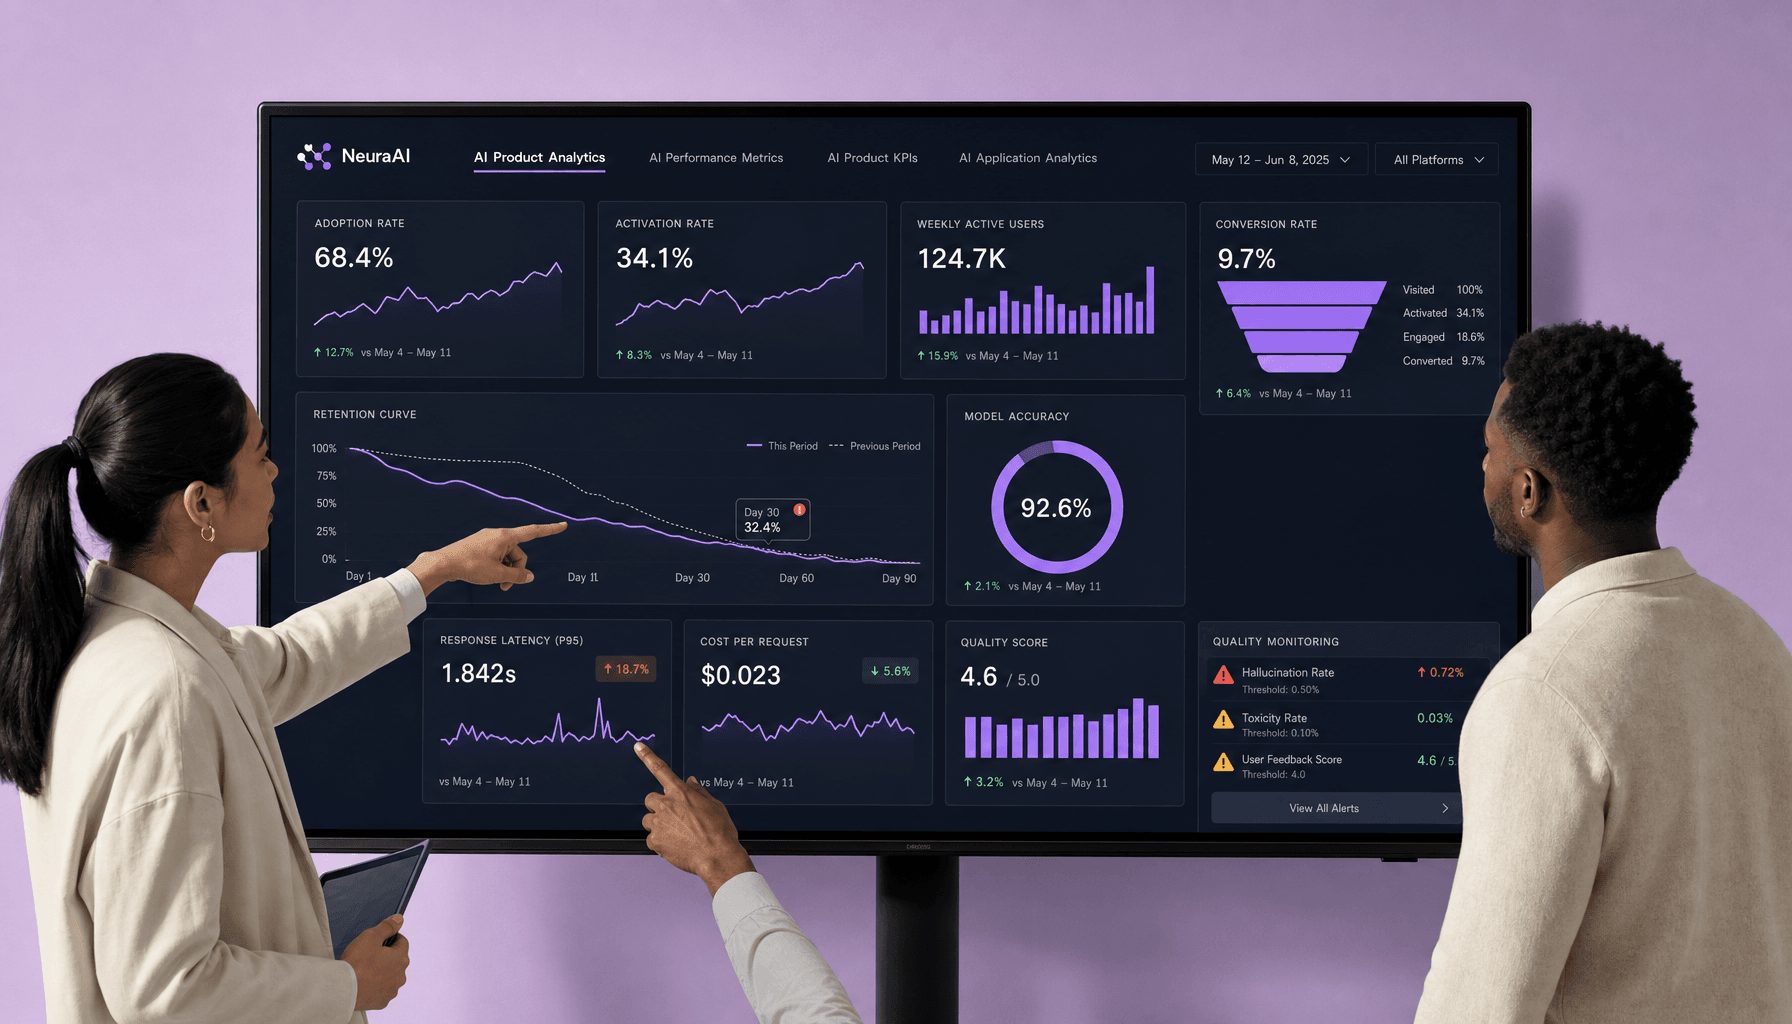
After launch, AI product analytics should track one system, not scattered metrics. Teams need to measure adoption, engagement, retention, model quality, latency, cost, and conversion together -- because a highly used AI feature can still be slow, expensive, or wrong.
The biggest mistake is treating AI performance metrics in isolation. A model can post solid accuracy while users abandon the flow, hit fallbacks, or never reach a successful outcome. The useful view combines product behavior, model behavior, and business results in one dashboard.
Track concrete AI product KPIs: adoption rate, activation rate, repeat usage, 7/30/90-day retention, task success rate, hallucination rate, time to first token, fallback rate, cost per successful task, and conversion lift. Include AI application analytics from feedback loops -- thumbs up/down, error reports, edited outputs, and abandonment points.
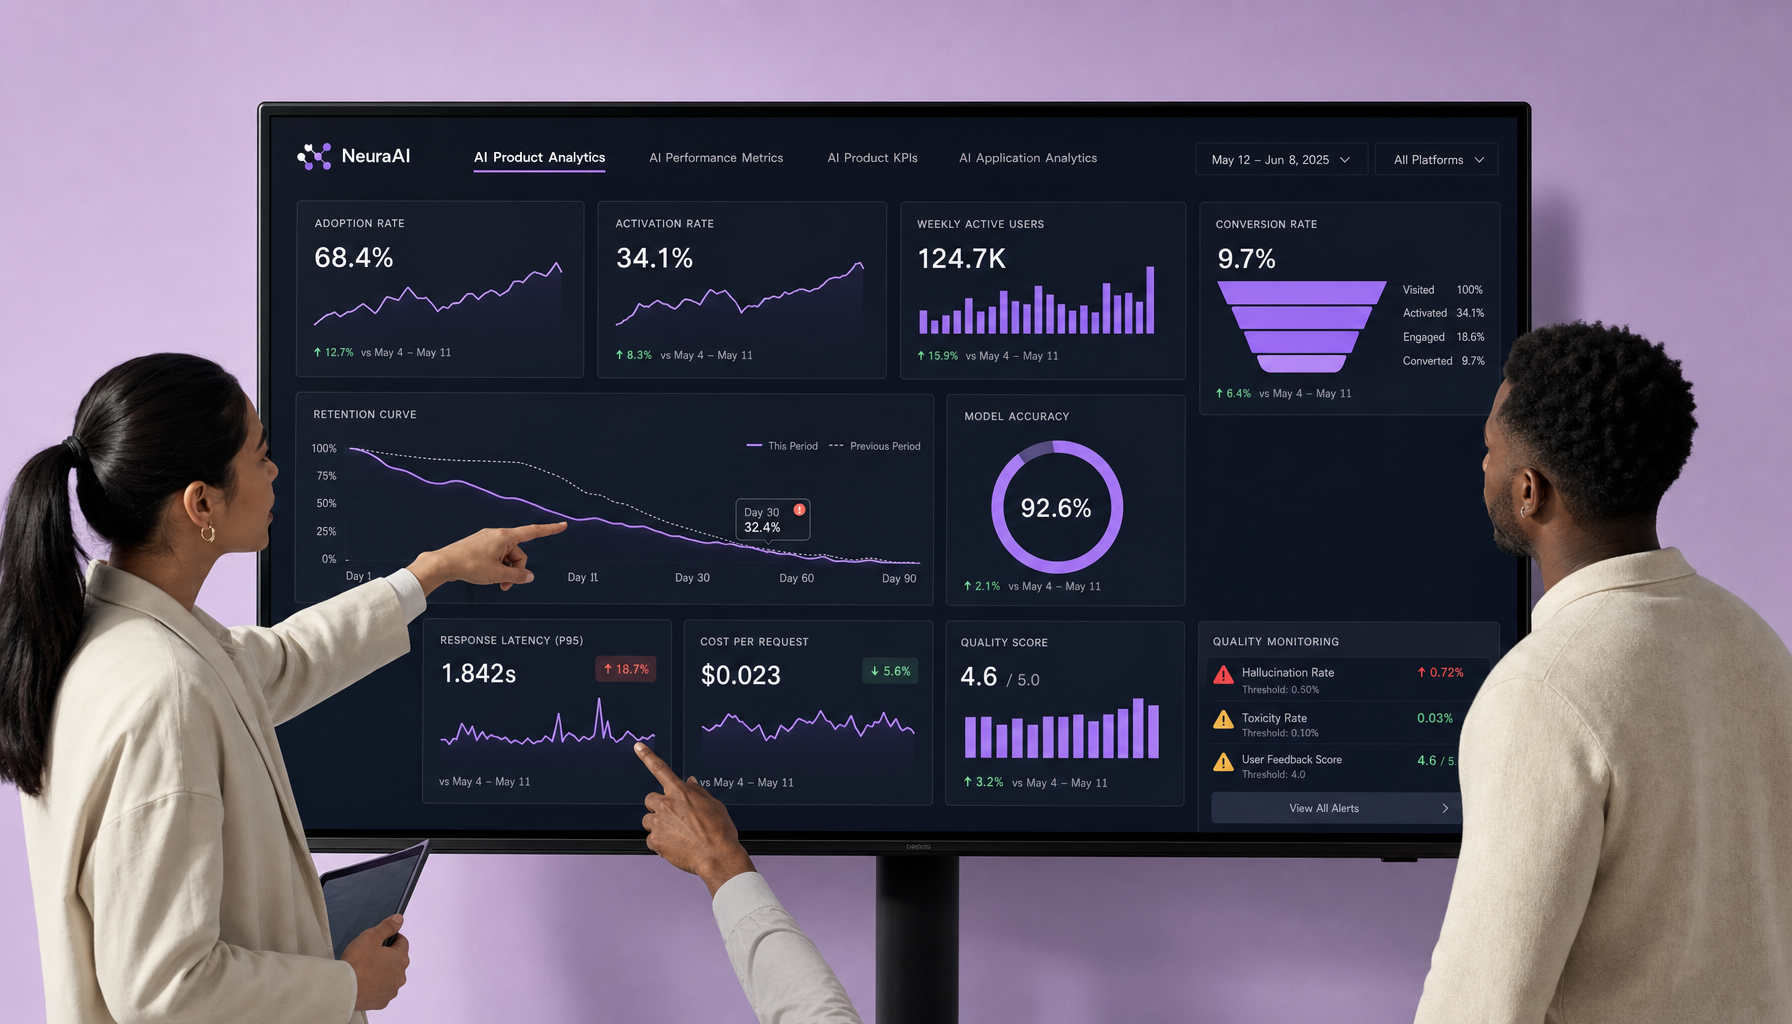
At Imversion Technologies Pvt Ltd, the practical bias is simple: decisions should be backed by data. But not vanity data. Post-launch analytics must answer one question clearly -- is the AI helping users complete real tasks reliably, fast enough, and at a cost the business can sustain?
Key Takeaways for AI Product Analytics
-
Track activation before retention. If users never reach a first successful outcome, 7/30/90-day retention tells a blurry story. Good AI product analytics starts with adoption rate, activation rate, and task completion -- then moves to repeat use.
-
Connect AI quality to business impact. Don’t stop at AI performance metrics like hallucination rate, task success rate, or time to first token. Map them to downstream conversion, support deflection, or revenue so teams know which quality issues actually hurt outcomes.
-
Build dashboards that join product, model, and system signals. One view should include engagement, latency, fallback rate, cost per successful task, and core AI product KPIs. Clarity beats complexity -- fragmented dashboards slow decisions.
-
Use user feedback and A/B tests together. Feedback explains why users trust or abandon the feature; experiments show whether a prompt, model, or UX change improves behavior without hurting guardrail metrics like cost or failure rate.
-
Prioritize reliability and cost early. Strong AI application analytics should catch slow responses, unstable outputs, and expensive workflows before scale turns them into product problems.
Why AI Product Analytics Matters More After Launch
Shipping is the easy milestone to celebrate. Proving the feature is actually useful is harder.
Launch proves one thing: the feature shipped.
It does not prove the AI feature creates durable value, performs well under messy real usage, or makes economic sense as volume grows. That is why AI product analytics matters more after launch than before it. Pre-launch testing can validate prompts, flows, and baseline quality. Production changes the game -- user intent varies, edge cases show up fast, and model drift can quietly lower output quality over time.
Teams often get fooled by early usage spikes. A new AI assistant, summarizer, or recommendation widget may attract clicks in week one. But if activation rate stays low, users are sampling -- not succeeding. If the retention curve drops after the first use, the feature created curiosity, not habit. If support tickets rise because outputs are wrong, unclear, or inconsistent, usage alone becomes a bad success signal.
So post-launch AI application analytics should connect four layers in one view: user behavior, model quality, system reliability, and business impact. That means tracking AI product KPIs such as activation rate, 7/30/90-day retention, conversion lift, support deflection, fallback rate, time to first token, hallucination rate, and cost per successful task.
Teams also need to push past top-line adoption and ask what is blocking value delivery. Slow latency? Weak onboarding? Poor answers on edge cases? A costly workflow with low repeat usage?
Here is the common trap: a writing assistant launches, requests surge, and internal teams call it a win. Then production monitoring shows rising latency at peak hours, quality drops for longer prompts, and cost per successful task climbs faster than conversion. The feature shipped. It still did not prove business value.
Shipping an AI capability is a product milestone. Proving it improves outcomes -- reliably, repeatedly, and at scale -- is an analytics job.
That is the purpose of strong AI performance metrics after launch. They turn excitement into evidence.
Core AI Performance Metrics and AI Product KPIs to Track
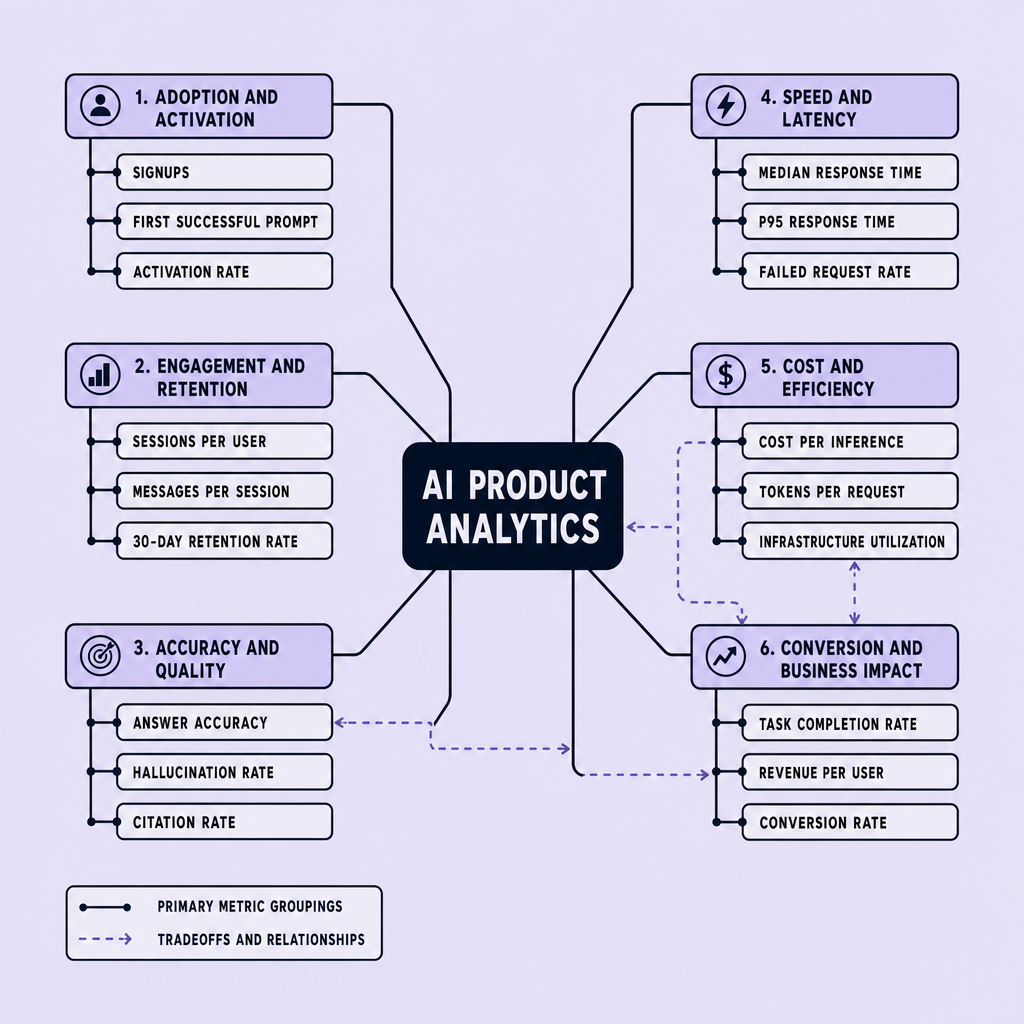
Once an AI feature is live, the problem is rarely a lack of data. It is knowing which signals deserve attention. Start with a small KPI set: adoption rate, activation rate, task success or quality, latency, cost per successful task, and conversion rate. Together, these metrics give teams a practical decision system instead of a dashboard full of noise.
Adoption and activation
Start with reach, then first value. Adoption rate = users who tried the AI feature / eligible users. Activation rate = users who reached the first successful outcome / users who tried it. A “successful outcome” must be concrete -- generated summary accepted, recommendation used, support answer resolved.
High adoption with low activation signals onboarding, UX, or quality problems. Low adoption with high activation usually points to discoverability, not model failure.
Engagement and retention
After activation, measure depth and habit. Use DAU/WAU, repeat usage, session depth, and feature-specific actions. Then track 7-day retention, 30-day retention, and 90-day retention for users who activated, not just users who clicked once.
Retention without activation context can mislead. Teams may celebrate repeat visits while users still avoid the AI feature itself.
Accuracy and quality
Accuracy alone is too narrow.
Use task success rate, precision, human rating, and hallucination rate. Add fallback rate when the system hands off to rules, search, or a human. These AI performance metrics show whether outputs are useful enough to earn trust. A model can score well offline and still fail in production because prompts, context windows, or user intent shift.
Latency and reliability
Measure time to first token, full response time, API failure rate, timeout rate, and uptime. These are core AI monitoring metrics. If response quality is strong but the system is slow or brittle, users stop trying.
A practical rule: treat latency and failure metrics as guardrails in every experiment, not secondary charts.
Cost, efficiency, and business impact
Track cost per request, token usage, infrastructure spend, and cost per successful task = total AI cost / successful outcomes. Then connect usage to conversion rate, revenue, or cost savings. For example, if an AI assistant increases checkout completion but also increases support escalations, the result is mixed.
Read AI product KPIs together. Better quality may raise cost, and faster responses may reduce precision. Understanding why a metric moved is what keeps AI application analytics useful.
Build an AI Analytics Dashboard That Connects Usage, Quality, and Cost
A dashboard can make an AI product easier to manage or much harder. The difference is whether it shows tradeoffs clearly. A useful dashboard does one job first: it shows whether the AI feature is creating value without hiding quality or cost problems behind top-line usage growth.
Most teams split this data across product analytics, model logs, and cloud billing. That breaks decision-making fast. An effective AI analytics dashboard should pull AI application analytics, AI monitoring metrics, and business outcomes into one reporting system so teams can see cause and effect in the same place.
Separate summary views from diagnostic views
Start with three views.
Executive view: adoption rate, activation rate, 7/30/90-day retention, conversion lift, cost per successful task, uptime against SLAs, and major incident count. This is the AI product KPIs layer. Keep it tight.
Product view: funnel analysis for onboarding and task completion, cohort analysis by signup date or plan, repeat usage, fallback rate, user feedback score, and workflow-level conversion. Segment by prompt type, user cohort, or workflow. Aggregate numbers hide failure modes -- a writing assistant may perform well for power users and fail badly for first-time users.
Engineering view: time to first token, full response latency, timeout rate, API error rate, hallucination rate, task success rate, model drift signals, token usage, and infrastructure spend. This is where observability, SLOs, and alerting live.
Balance leading and lagging indicators
Not every metric helps at the same time. Leading indicators show trouble early: fallback rate, latency spikes, low activation, rising cost per request, negative feedback, or prompt-specific error clusters. Lagging indicators confirm impact: retention, conversion, support deflection, and revenue change.
But do not overload one screen.
A practical cadence works better:
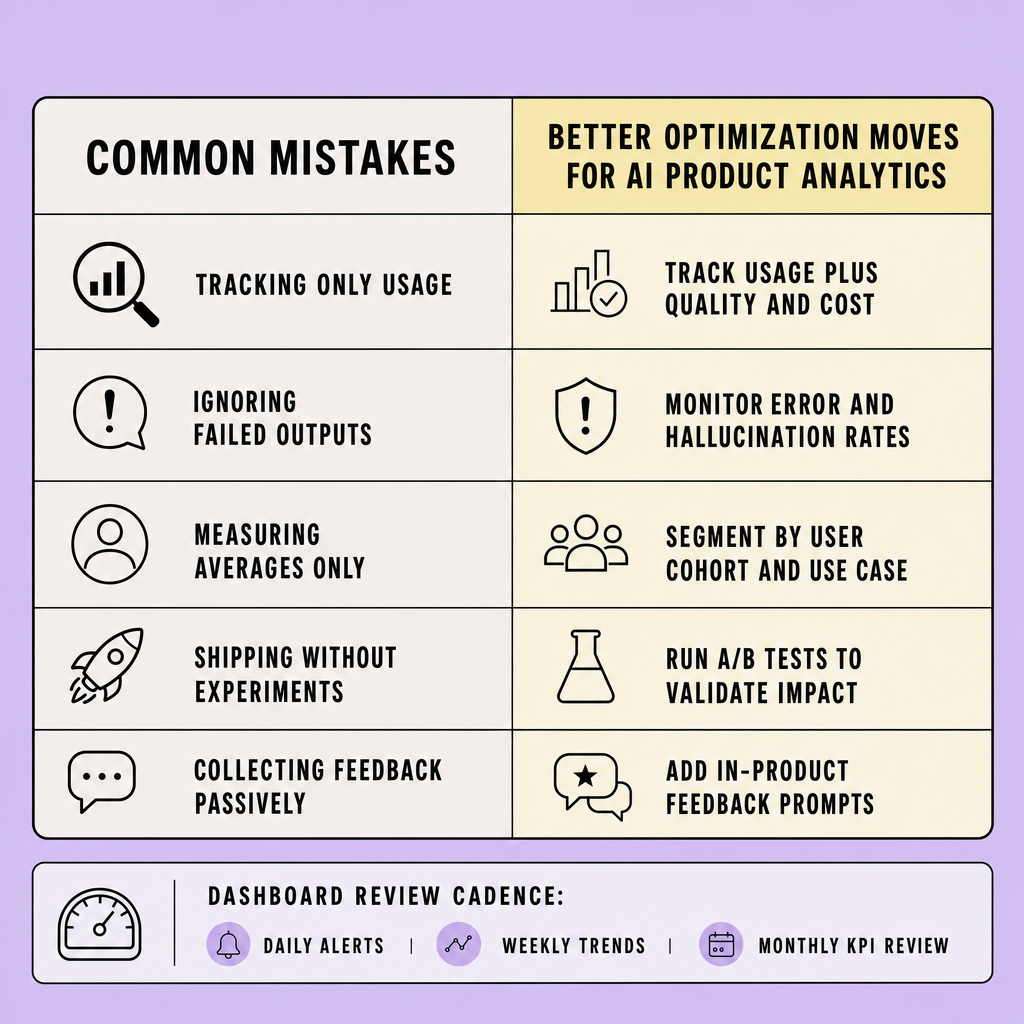
- Daily: engineering review of reliability, latency, failures, and spend anomalies
- Weekly: product review of activation, engagement, segmentation, and A/B test guardrails
- Monthly: executive review of trendlines across growth, quality, and unit economics
Use thresholds that trigger investigation
Dashboards are passive unless they force action. Set alerts before users complain. Example: if time to first token jumps above the team’s SLO, fallback rate rises, or cost per successful task increases while conversion stays flat, investigate immediately.
Reliable systems matter most -- because a feature users cannot trust will fail even if adoption looks healthy for a week.
One caveat: never report model quality without user behavior next to it. A small accuracy drop may not matter if task completion holds. A “good” model score means little if latency kills the workflow.
Use User Feedback, A/B Testing, and AI Quality Monitoring Together
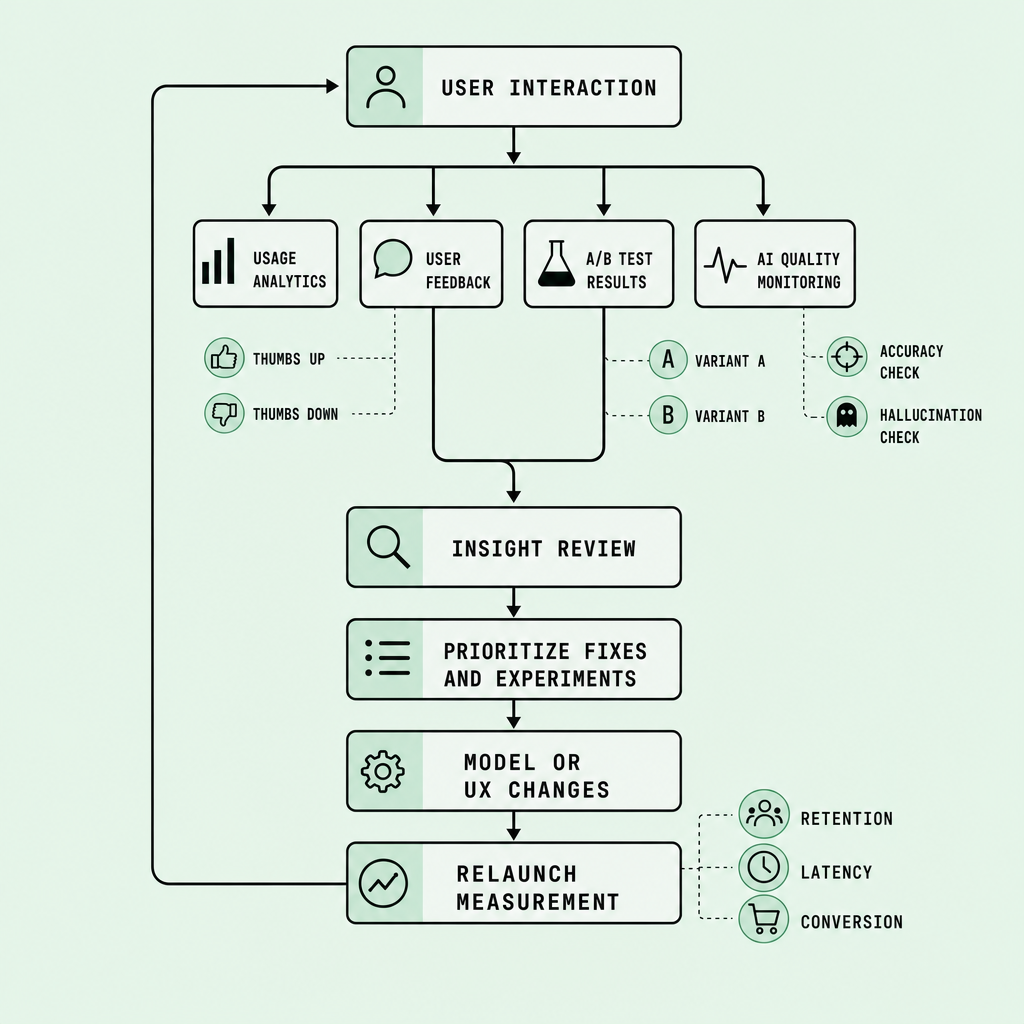
Teams usually reach for one signal and over-trust it. Usage charts look healthy, so quality issues get missed. Feedback gets loud, so teams react without evidence. Experiment results improve one metric, while cost or failure rate quietly gets worse. Post-launch analytics works better when these signals are read together.
Usage growth alone is not proof that an AI feature is good. Teams need three inputs working together: explicit feedback, implicit behavior signals, and experiment data.
Capture feedback, but do not trust it alone
Start with simple thumbs-up/down controls on every meaningful AI output. Then make the negative path useful: issue tagging for wrong answer, irrelevant answer, unsafe response, too slow, or bad format. Route flagged samples into a review workflow so product, ops, or human evaluation teams can inspect patterns instead of isolated complaints.
Feedback buttons are incomplete. Many users do not report bad outputs; they just abandon the flow, retry, or rewrite the prompt. So AI product analytics should also track behavioral signals like regeneration rate, copy rate, abandonment after response, fallback to manual workflow, and task success rate. Those signals often reveal friction before users say anything.
Use A/B testing to validate changes safely
A/B testing helps teams improve prompts, retrieval settings, model choice, or UI without guessing. A practical example: test two onboarding prompt variants for an AI assistant. Variant A asks one broad question. Variant B uses a structured starter form. The success metric might be activation or task success rate. But guardrail metrics must sit beside it -- latency, cost per successful task, unsafe response rate, hallucination detection rate, and fallback rate.
A lift in conversion means little if quality drops or cost spikes.
Offline evaluation should happen first. Compare outputs against labeled examples, rubric scoring, or human evaluation before release. Then confirm online impact with live AI monitoring metrics and user behavior.
Keep monitoring quality after launch
The deceptive part of AI systems is that stable top-line AI product KPIs can hide degradation. Drift monitoring may show input patterns changing. Relevance can fall for one segment while aggregate metrics look flat. Unsafe responses can cluster around a new use case. Hallucination detection, degraded relevance checks, and periodic human review should run continuously.
Good AI performance metrics do not end at launch; they form a feedback loop that keeps quality, trust, and cost aligned.
That is how teams validate and improve AI quality after launch -- with feedback, controlled experiments, and ongoing AI application analytics working as one system.
Frequently Asked Questions
What is the difference between AI product analytics and standard product analytics?
AI product analytics extends standard product analytics by combining user behavior with model quality, system reliability, and cost signals. A normal feature may only need funnel and retention data, but an AI feature also needs output quality, fallback behavior, latency, and unit economics to explain whether users are actually receiving useful results.
Which AI product analytics metrics should a small team prioritize first?
A small team should start with adoption rate, activation rate, task success rate, latency, cost per successful task, and retention for activated users. This set is small enough to manage and strong enough to reveal whether the feature is being discovered, delivering value, staying reliable, and supporting a sustainable business model.
How often should teams review AI performance metrics after launch?
Teams should review operational AI performance metrics daily, product behavior weekly, and business impact monthly. This rhythm works because reliability and cost issues can escalate within hours, while retention and conversion trends need more time to become meaningful. Review frequency should match how quickly each metric can change and how fast action is required.
Why should AI product analytics include segmentation by cohort or workflow?
AI product analytics should include segmentation because aggregate performance can hide serious failures in specific user groups, prompts, or tasks. A model may appear healthy overall while underperforming for new users, enterprise accounts, or high-complexity requests. Segmentation makes optimization more precise and prevents teams from shipping fixes that only help the average case.
How does AI application analytics help reduce wasted model spend?
AI application analytics reduces wasted model spend by showing where expensive requests fail to create user value. It identifies patterns such as repeated retries, low-success prompts, unnecessary long-context calls, and workflows with poor conversion. That evidence helps teams redesign flows, route requests better, and cut cost without guessing where inefficiency actually sits.
Make Imversion a preferred source on Google
Like this kind of AI and software analysis? Add Imversion as a preferred source so Google can highlight our articles for you in Search, AI Overviews, and AI Mode.